UNITED STATES
SECURITIES AND EXCHANGE COMMISSION
WASHINGTON, DC 20549
FORM
CURRENT REPORT
Pursuant to Section 13 or 15(d)
of the Securities Exchange Act of 1934
Date of Report (Date of earliest event reported):
(Exact name of registrant as specified in its charter)
| (State or other jurisdiction of incorporation) |
(Commission File Number) |
(IRS Employer Identification No.) |
(Address of principal executive offices) (Zip code)
Registrant’s telephone number, including area code
N/A
(Former name or former address, if changed since last report)
Check the appropriate box below if the Form 8-K filing is intended to simultaneously satisfy the filing obligation of the registrant under any of the following provisions:
| Written communications pursuant to Rule 425 under the Securities Act (17 CFR 230.425) |
| Soliciting material pursuant to Rule 14a-12 under the Exchange Act (17 CFR 240.14a-12) |
| Pre-commencement communications pursuant to Rule 14d-2(b) under the Exchange Act (17 CFR 240.14d-2(b)) |
| Pre-commencement communications pursuant to Rule 13e-4(c) under the Exchange Act (17 CFR 240.13e-4(c)) |
Securities registered pursuant to Section 12(b) of the Act:
| Title of each class |
Trading symbol(s) |
Name of each exchange on which registered | ||
Indicate by check mark whether the registrant is an emerging growth company as defined in Rule 405 of the Securities Act of 1933 (17 CFR §230.405) or Rule 12b-2 of the Securities Exchange Act of 1934 (17 CFR §240.12b-2).
Emerging growth company
If an emerging growth company, indicate by check mark if the registrant has elected not to use the extended transition period for complying with any new or revised financial accounting standards provided pursuant to Section 13(a) of the Exchange Act. ☐
ITEM 7.01 REGULATION FD DISCLOSURE.
On June 1, 2026, The Macerich Company (the “Company”) made available on the Investor Relations section of its website, investing.macerich.com, an investor presentation describing the Company’s business and Path Forward Plan update. A copy of the presentation is attached hereto as Exhibit 99.1. The information set forth in this Item 7.01 and in the presentation, attached hereto as Exhibit 99.1, is deemed to be “furnished” and shall not be deemed to be “filed” for purposes of Section 18 of the Securities Exchange Act of 1934, as amended (the “Exchange Act”), or otherwise subject to the liabilities of that Section. The information set forth in this Item 7.01, including Exhibit 99.1, shall not be deemed incorporated by reference into any filing under the Exchange Act or the Securities Act of 1933, as amended, regardless of any general incorporation language in such filing.
ITEM 9.01 FINANCIAL STATEMENTS AND EXHIBITS.
| 99.1 | Investor Presentation | |
| 104 | Cover Page Interactive Data File (embedded within the Inline XBRL document). | |
SIGNATURES
Pursuant to the requirements of the Securities Exchange Act of 1934, The Macerich Company has duly caused this report to be signed on its behalf by the undersigned hereunto duly authorized.
| THE MACERICH COMPANY | ||||||
| By: Daniel E. Swanstrom II | ||||||
| June 1, 2026 | /s/ Daniel E. Swanstrom II | |||||
| Date | Senior Executive Vice President, Chief Financial Officer and Treasurer | |||||
Exhibit 99.1 MACERICH INVESTOR PRESENTATION June 2026 NYSE: MAC | Macerich.com Crabtree | Raleigh, NC
LEGAL DISCLAIMER Note: This document contains statements that constitute forward-looking statements, which can be identified by the use of words, such as “will,” “expects,” “pro forma”, “anticipates,” “assumes,” “believes,” “estimated,” “guidance,” “potential,” “target,” “projects,” “scheduled” and similar expressions that do not relate to historical matters, and includes expectations regarding the Company’s future operational results, including the Path Forward Plan and its ability to meet the established goals under such Plan, including growth rates and acquisition and disposition goals, as well as development, redevelopment and expansion activities. Stockholders are cautioned that any such forward-looking statements are not guarantees of future performance and involve risks, uncertainties and other factors that may cause actual results, performance or achievements of the Company to vary materially from those anticipated, expected or projected. Such factors include, among others, general industry, as well as global, national, regional and local economic and business conditions, including the impact of geopolitical tensions, tariffs, elevated interest rates and inflation, which will, among other things, affect demand for retail space or retail goods, availability and creditworthiness of current and prospective tenants, anchor or tenant bankruptcies, closures, mergers or consolidations, lease rates, terms and payments, elevated interest rates and its impact on the financial condition and results of operations of the Company, including as a result of any increased borrowing costs on the Company's outstanding floating-rate debt and defaults on mortgage loans, availability, terms and cost of financing and operating expenses; adverse changes in the real estate markets including, among other things, competition from other companies, retail formats and technology, risks of real estate development and redevelopment (including elevated inflation, supply chain disruptions and construction delays), acquisitions and dispositions; adverse impacts from any pandemic, epidemic or outbreak of any highly infectious disease on the U.S., regional and global economies and the financial condition and results of operations of the Company and its tenants; the liquidity of real estate investments; governmental shutdowns and other governmental actions and initiatives (including legislative and regulatory changes); environmental and safety requirements; and terrorist activities or other acts of violence, which could adversely affect all of the above factors. The reader is directed to the Company’s various filings with the Securities and Exchange Commission, including the Annual Report on Form 10-K for the year ended December 31, 2025, for a discussion of such risks and uncertainties, which discussion is incorporated herein by reference. You are cautioned not to place undue reliance on these forward-looking statements, which speak only as of the date of this document. The Company does not intend, and undertakes no obligation, to update any forward-looking information to reflect events or circumstances after the date of this document or to reflect the occurrence of unanticipated events unless required by law to do so. 2 Copyright © 2026 Macerich
TABLE OF CONTENTS § Macerich Overview § The Mall Resurgence § Path Forward Plan v 3.0 § Elevate & Transform Case Studies § Portfolio and Financial Overview § 2028 and Beyond § Appendix 3 Copyright © 2026 Macerich

MACERICH OVERVIEW 4 Freehold Raceway Mall | Freehold, NJ
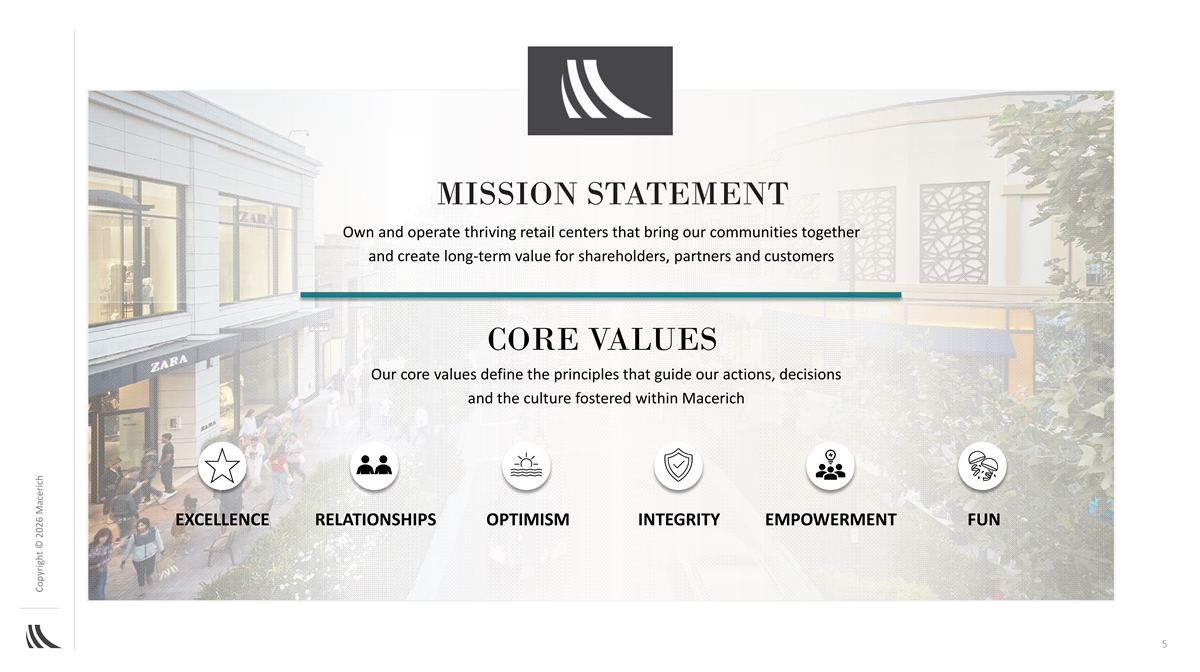
MISSION STATEMENT Own and operate thriving retail centers that bring our communities together and create long-term value for shareholders, partners and customers CORE VALUES Our core values define the principles that guide our actions, decisions and the culture fostered within Macerich EXCELLENCE RELATIONSHIPS OPTIMISM INTEGRITY EMPOWERMENT FUN 5 Copyright © 2026 Macerich
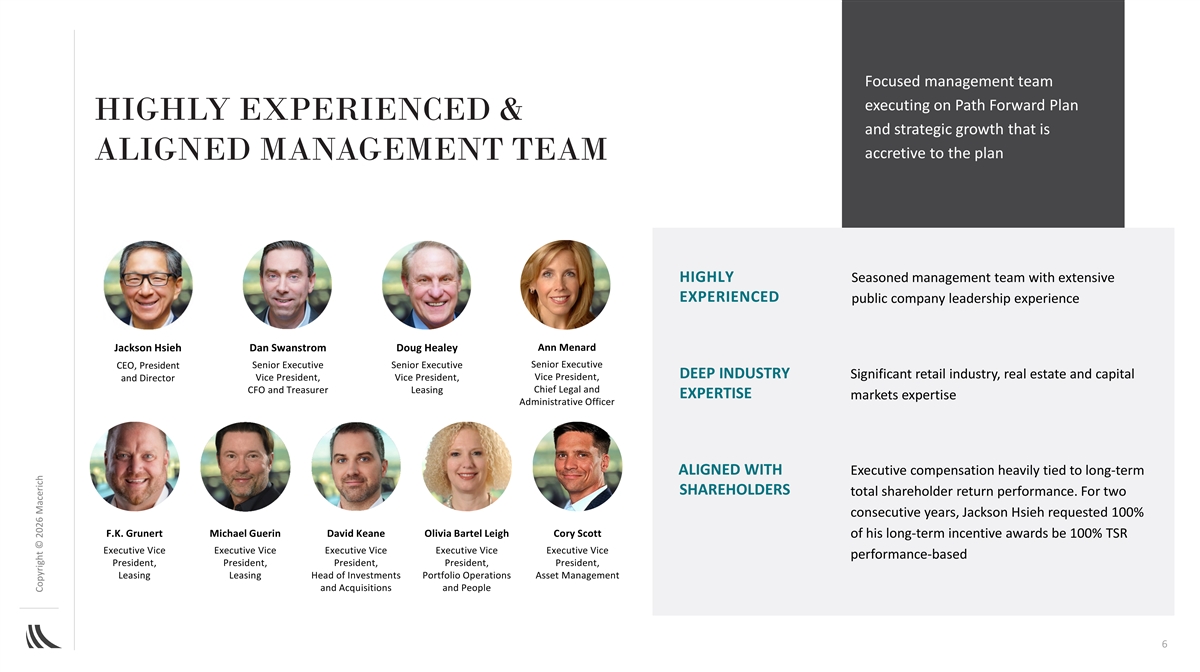
Focused management team executing on Path Forward Plan HIGHLY EXPERIENCED & and strategic growth that is accretive to the plan ALIGNED MANAGEMENT TEAM HIGHLY Seasoned management team with extensive EXPERIENCED public company leadership experience Ann Menard Jackson Hsieh Dan Swanstrom Doug Healey Senior Executive CEO, President Senior Executive Senior Executive DEEP INDUSTRY Significant retail industry, real estate and capital Vice President, Vice President, Vice President, and Director Chief Legal and CFO and Treasurer Leasing EXPERTISE markets expertise Administrative Officer ALIGNED WITH Executive compensation heavily tied to long-term SHAREHOLDERS total shareholder return performance. For two consecutive years, Jackson Hsieh requested 100% F.K. Grunert Michael Guerin David Keane Olivia Bartel Leigh Cory Scott of his long-term incentive awards be 100% TSR Executive Vice Executive Vice Executive Vice Executive Vice Executive Vice performance-based President, President, President, President, President, Leasing Leasing Head of Investments Portfolio Operations Asset Management and Acquisitions and People 6 Copyright © 2026 Macerich

Macerich prioritizes board independence and refreshment, SEASONED BOARD & along with sound governance policies and practices SOUND CORPORATE GOVERNANCE INDEPENDENT BOARD Seven of our eight directors are independent, AND CHAIRPERSON including our Chairman of the Board BOARD Over 60% of our directors have been elected to Steven R. Hash Jackson Hsieh Enrique Hernandez, Jr. Daniel Hirsch Independent Chairman CEO, President & Director Independent Director Independent Director REFRESHMENT our Board since 2018 MUTA Opted out of the provisions of MUTA, and OPT OUT prohibited from opting back in without shareholder approval NO POISON Diana Laing Marianne Lowenthal Devin Murphy Andrea Stephen No shareholder rights plan in effect PILL Independent Director Independent Director Independent Director Independent Director 7 Copyright © 2026 Macerich
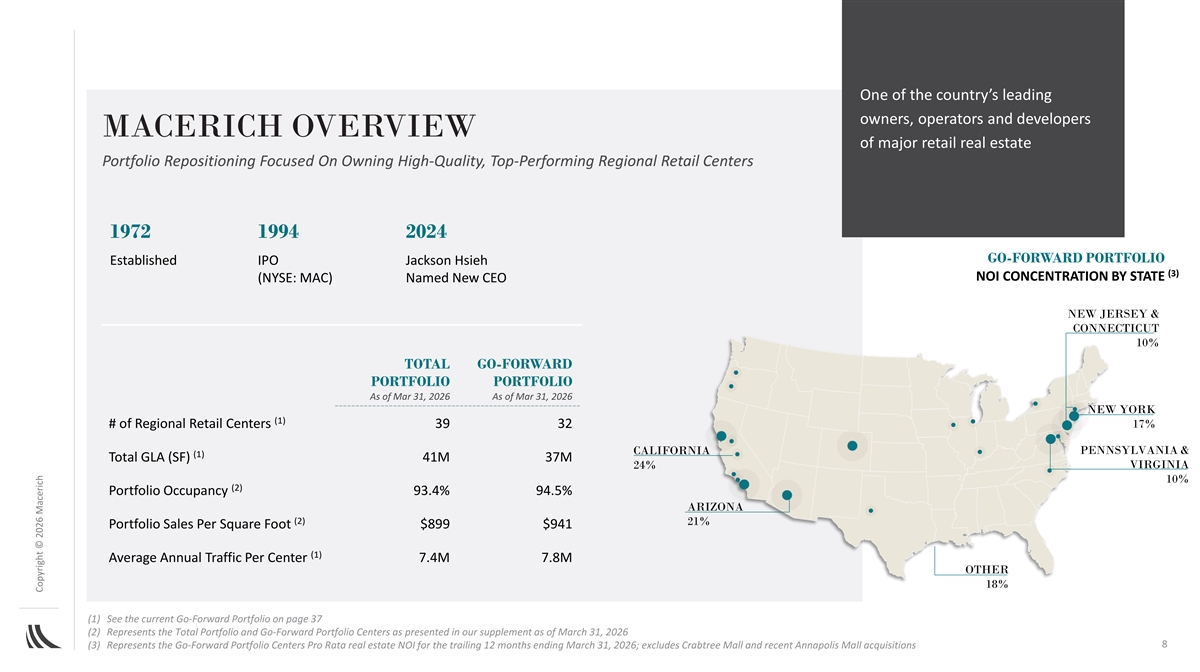
One of the country’s leading owners, operators and developers MACERICH OVERVIEW of major retail real estate Portfolio Repositioning Focused On Owning High-Quality, Top-Performing Regional Retail Centers 1972 1994 2024 GO-FORWARD PORTFOLIO Established IPO Jackson Hsieh (3) NOI CONCENTRATION BY STATE (NYSE: MAC) Named New CEO NEW JERSEY & CONNECTICUT 10% TOTAL GO-FORWARD PORTFOLIO PORTFOLIO As of Mar 31, 2026 As of Mar 31, 2026 NEW YORK (1) # of Regional Retail Centers 39 32 17% PENNSYLVANIA & CALIFORNIA (1) Total GLA (SF) 41M 37M VIRGINIA 24% 10% (2) Portfolio Occupancy 93.4% 94.5% ARIZONA (2) 21% Portfolio Sales Per Square Foot $899 $941 (1) Average Annual Traffic Per Center 7.4M 7.8M OTHER 18% (1) See the current Go-Forward Portfolio on page 37 (2) Represents the Total Portfolio and Go-Forward Portfolio Centers as presented in our supplement as of March 31, 2026 8 (3) Represents the Go-Forward Portfolio Centers Pro Rata real estate NOI for the trailing 12 months ending March 31, 2026; excludes Crabtree Mall and recent Annapolis Mall acquisitions Copyright © 2026 Macerich
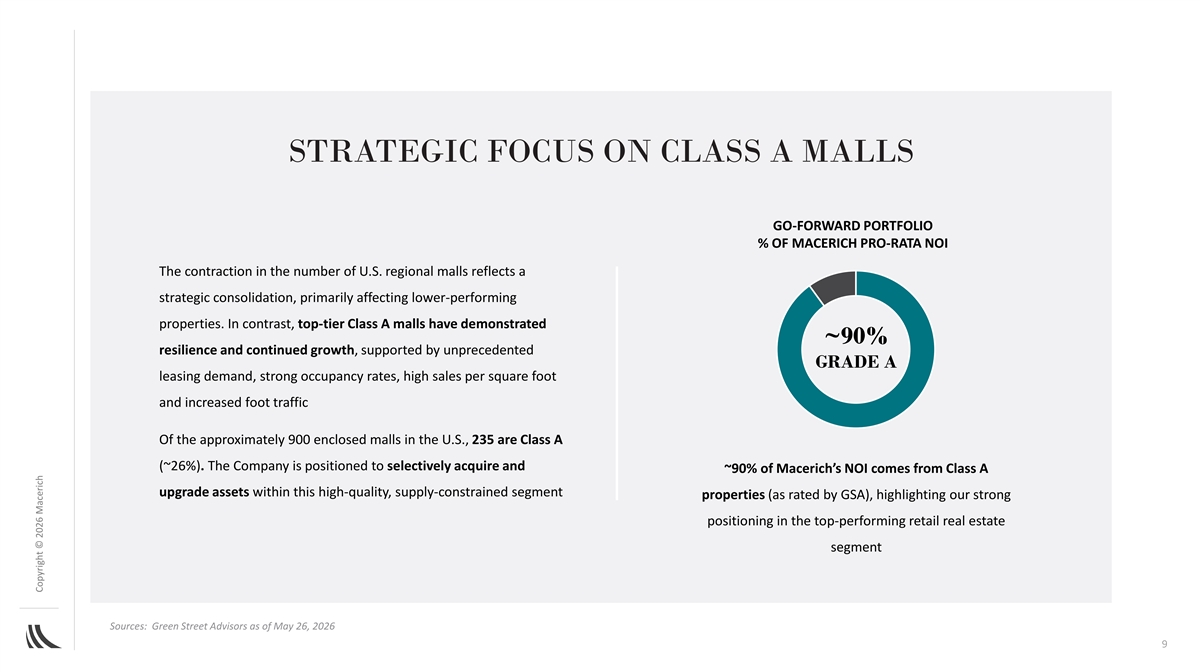
STRATEGIC FOCUS ON CLASS A MALLS GO-FORWARD PORTFOLIO % OF MACERICH PRO-RATA NOI The contraction in the number of U.S. regional malls reflects a strategic consolidation, primarily affecting lower-performing properties. In contrast, top-tier Class A malls have demonstrated ~90% resilience and continued growth, supported by unprecedented GRADE A leasing demand, strong occupancy rates, high sales per square foot and increased foot traffic Of the approximately 900 enclosed malls in the U.S., 235 are Class A (~26%). The Company is positioned to selectively acquire and ~90% of Macerich’s NOI comes from Class A upgrade assets within this high-quality, supply-constrained segment properties (as rated by GSA), highlighting our strong positioning in the top-performing retail real estate segment Sources: Green Street Advisors as of May 26, 2026 9 Copyright © 2026 Macerich
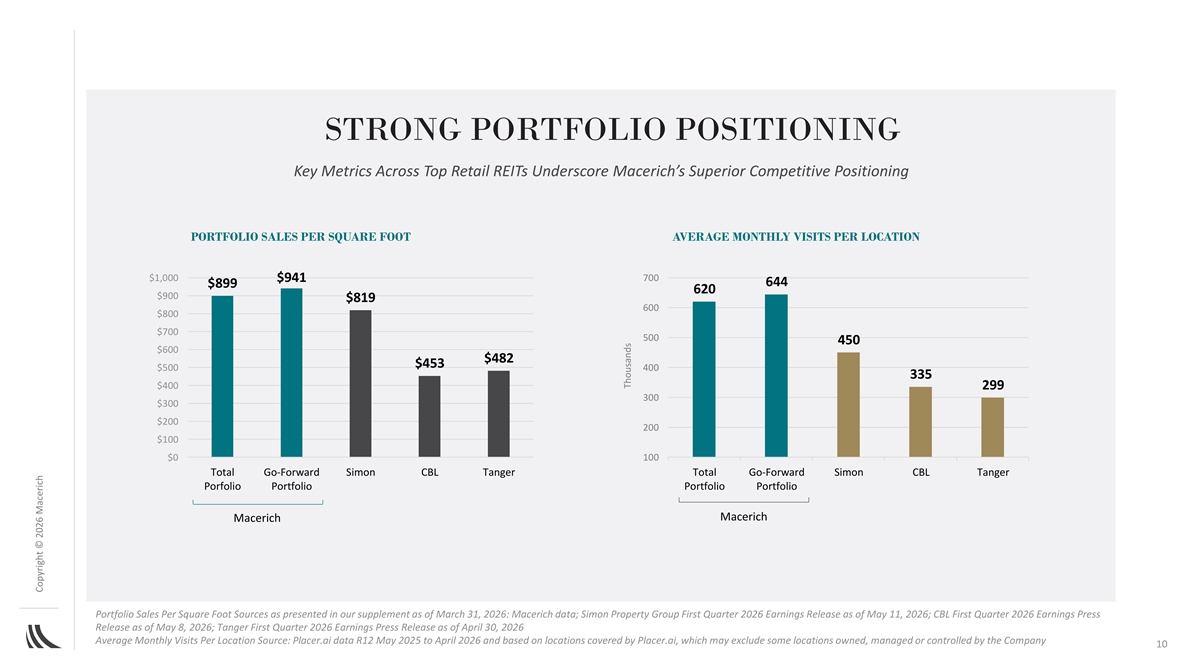
STRONG PORTFOLIO POSITIONING Key Metrics Across Top Retail REITs Underscore Macerich’s Superior Competitive Positioning PORTFOLIO SALES PER SQUARE FOOT AVERAGE MONTHLY VISITS PER LOCATION $1,000 700 $941 644 $899 620 $900 $819 600 $800 $700 500 450 $600 $482 $453 $500 400 335 $400 299 300 $300 $200 200 $100 $0 100 Total Go-Forward Simon CBL Tanger Total Go-Forward Simon CBL Tanger Porfolio Portfolio Portfolio Portfolio Macerich Macerich Portfolio Sales Per Square Foot Sources as presented in our supplement as of March 31, 2026: Macerich data; Simon Property Group First Quarter 2026 Earnings Release as of May 11, 2026; CBL First Quarter 2026 Earnings Press Release as of May 8, 2026; Tanger First Quarter 2026 Earnings Press Release as of April 30, 2026 Average Monthly Visits Per Location Source: Placer.ai data R12 May 2025 to April 2026 and based on locations covered by Placer.ai, which may exclude some locations owned, managed or controlled by the Company 10 Copyright © 2026 Macerich Thousands

THE MALL RESURGENCE 11 Arrowhead Towne Center | Glendale, AZ
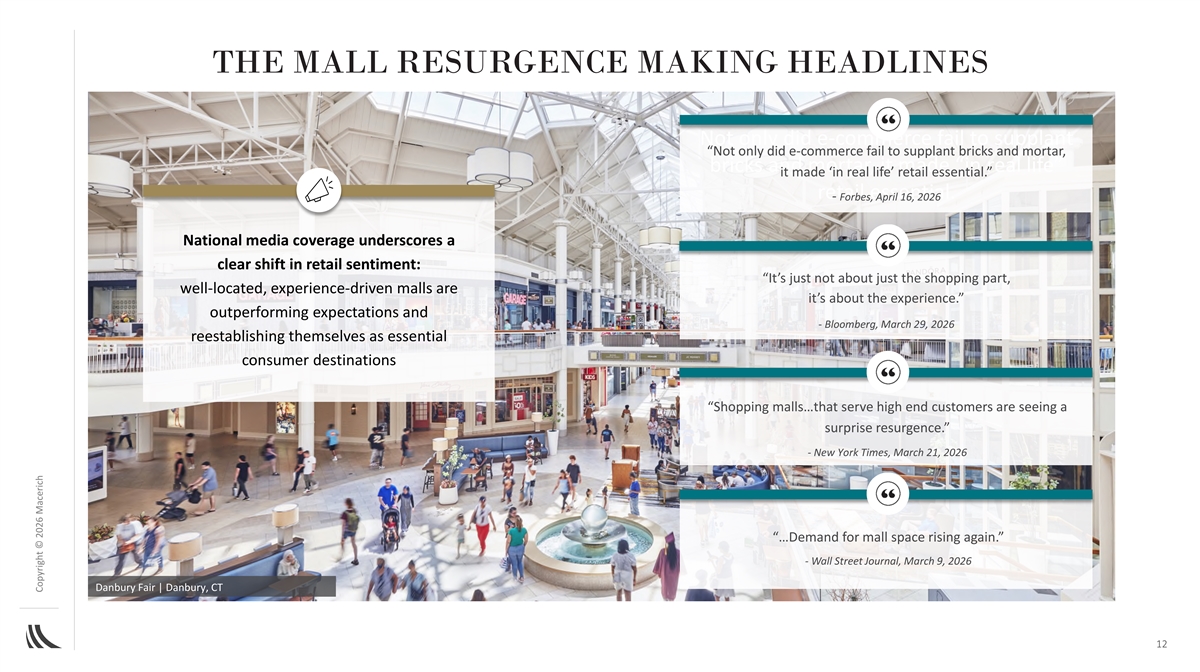
THE MALL RESURGENCE MAKING HEADLINES Not only did e-commerce fail to supplant “Not only did e-commerce fail to supplant bricks and mortar, bricks and mortar, it made “in real life” it made ‘in real life’ retail essential.” retail essential. - Forbes, April 16, 2026 National media coverage underscores a clear shift in retail sentiment: “It’s just not about just the shopping part, well-located, experience-driven malls are it’s about the experience.” outperforming expectations and - Bloomberg, March 29, 2026 reestablishing themselves as essential consumer destinations “Shopping malls…that serve high end customers are seeing a surprise resurgence.” - New York Times, March 21, 2026 “…Demand for mall space rising again.” - Wall Street Journal, March 9, 2026 Danbury Fair | Danbury, CT 12 Copyright © 2026 Macerich
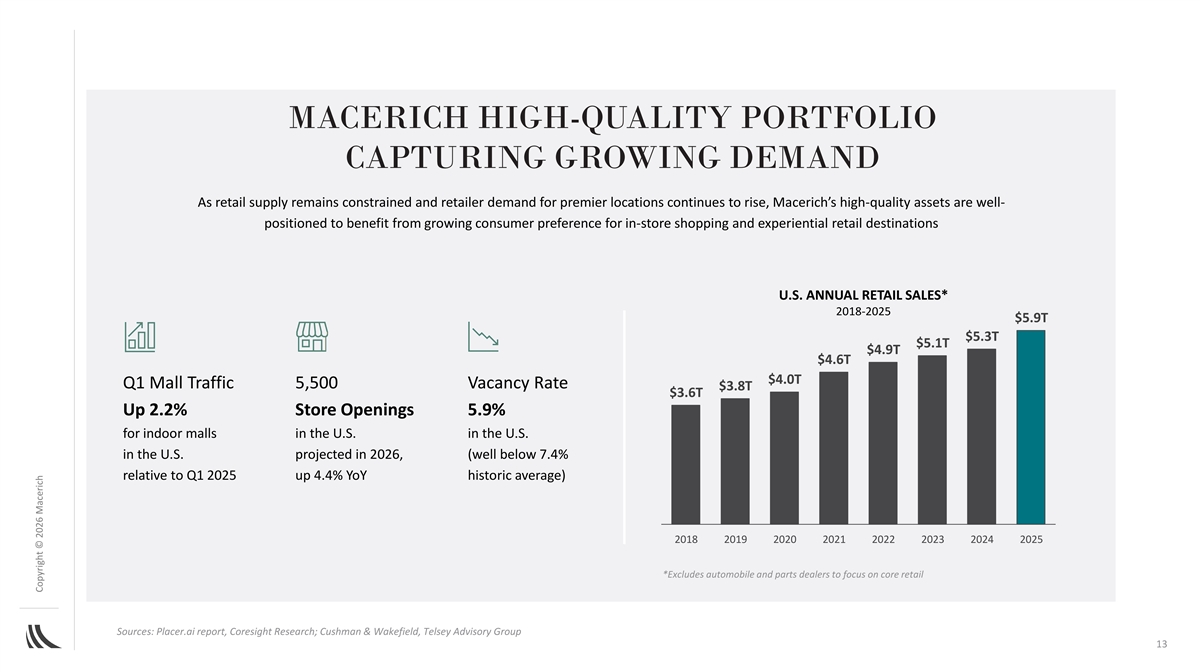
MACERICH HIGH-QUALITY PORTFOLIO CAPTURING GROWING DEMAND As retail supply remains constrained and retailer demand for premier locations continues to rise, Macerich’s high-quality assets are well- positioned to benefit from growing consumer preference for in-store shopping and experiential retail destinations U.S. ANNUAL RETAIL SALES* 2018-2025 $5.9T $5.3T $5.1T $4.9T $4.6T $4.0T Q1 Mall Traffic 5,500 Vacancy Rate $3.8T $3.6T Up 2.2% Store Openings 5.9% for indoor malls in the U.S. in the U.S. in the U.S. projected in 2026, (well below 7.4% relative to Q1 2025 up 4.4% YoY historic average) 2018 2019 2020 2021 2022 2023 2024 2025 *Excludes automobile and parts dealers to focus on core retail Sources: Placer.ai report, Coresight Research; Cushman & Wakefield, Telsey Advisory Group 13 Copyright © 2026 Macerich
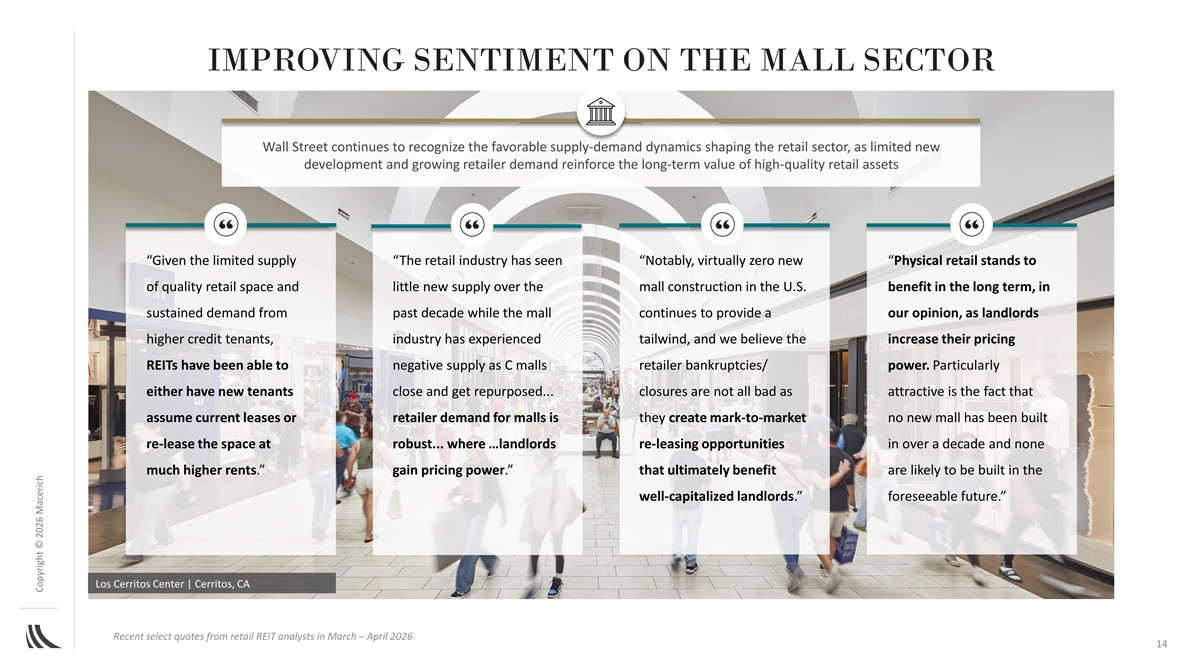
IMPROVING SENTIMENT ON THE MALL SECTOR Wall Street continues to recognize the favorable supply-demand dynamics shaping the retail sector, as limited new development and growing retailer demand reinforce the long-term value of high-quality retail assets “Given the limited supply “The retail industry has seen “Notably, virtually zero new “Physical retail stands to of quality retail space and little new supply over the mall construction in the U.S. benefit in the long term, in sustained demand from past decade while the mall continues to provide a our opinion, as landlords higher credit tenants, industry has experienced tailwind, and we believe the increase their pricing REITs have been able to negative supply as C malls retailer bankruptcies/ power. Particularly either have new tenants close and get repurposed... closures are not all bad as attractive is the fact that assume current leases or retailer demand for malls is they create mark-to-market no new mall has been built re-lease the space at robust... where …landlords re-leasing opportunities in over a decade and none much higher rents.” gain pricing power.” that ultimately benefit are likely to be built in the well-capitalized landlords.” foreseeable future.” Los Cerritos Center | Cerritos, CA Recent select quotes from retail REIT analysts in March – April 2026 14 Copyright © 2026 Macerich
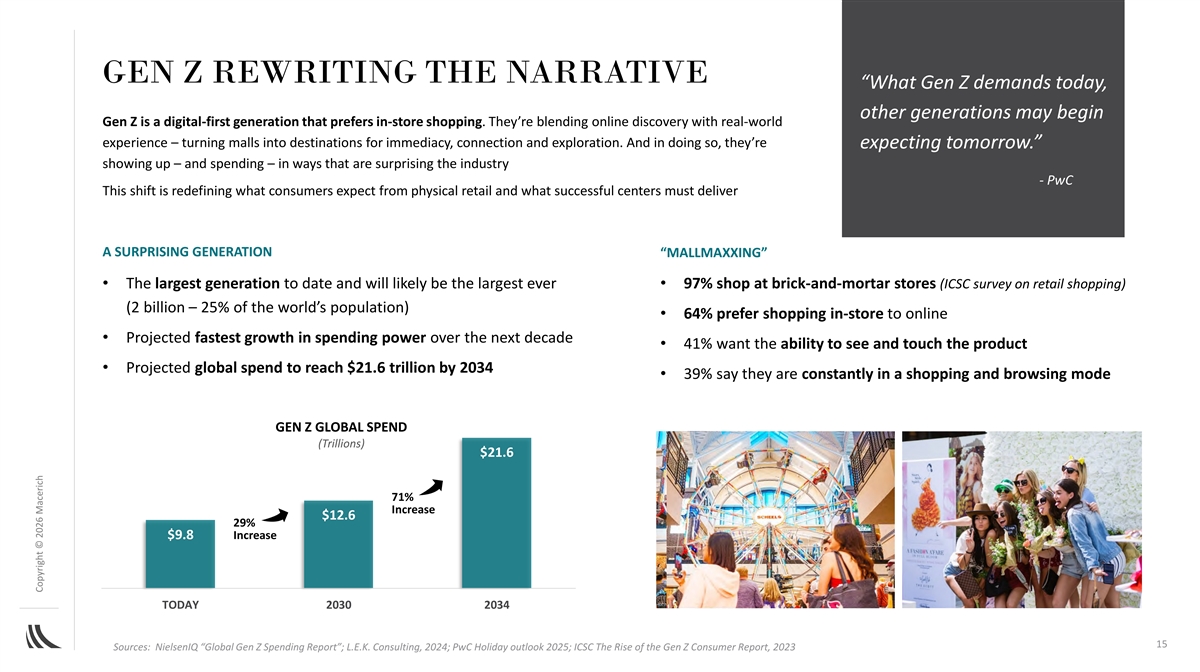
GEN Z REWRITING THE NARRATIVE “What Gen Z demands today, other generations may begin Gen Z is a digital-first generation that prefers in-store shopping. They’re blending online discovery with real-world experience – turning malls into destinations for immediacy, connection and exploration. And in doing so, they’re expecting tomorrow.” showing up – and spending – in ways that are surprising the industry - PwC This shift is redefining what consumers expect from physical retail and what successful centers must deliver A SURPRISING GENERATION “MALLMAXXING” • The largest generation to date and will likely be the largest ever • 97% shop at brick-and-mortar stores (ICSC survey on retail shopping) (2 billion – 25% of the world’s population) • 64% prefer shopping in-store to online • Projected fastest growth in spending power over the next decade • 41% want the ability to see and touch the product • Projected global spend to reach $21.6 trillion by 2034 • 39% say they are constantly in a shopping and browsing mode GEN Z GLOBAL SPEND (Trillions) $21.6 71% Increase $12.6 29% $9.8 Increase TODAY 2030 2034 15 Sources: NielsenIQ “Global Gen Z Spending Report”; L.E.K. Consulting, 2024; PwC Holiday outlook 2025; ICSC The Rise of the Gen Z Consumer Report, 2023 Copyright © 2026 Macerich

HOW WE EVOLVE FOR WHAT’S NEXT Macerich is evolving to meet the expectations of this generation through deeper consumer insights and meaningful perspectives that are helping shape the future of our malls into more engaging, camera-ready environments designed for connection and longer, more meaningful experiences Macerich Academic Partnerships: Gen Z Committee Wharton & Notre Dame Established to deepen internal Collaborating with students to expertise and guide the evolution of translate Gen Z behavior and our centers to earn the loyalty and preferences into an actionable growing spending power of the next strategy to ensure continued generation well beyond 2028 cultural and economic relevance 16 Copyright © 2026 Macerich
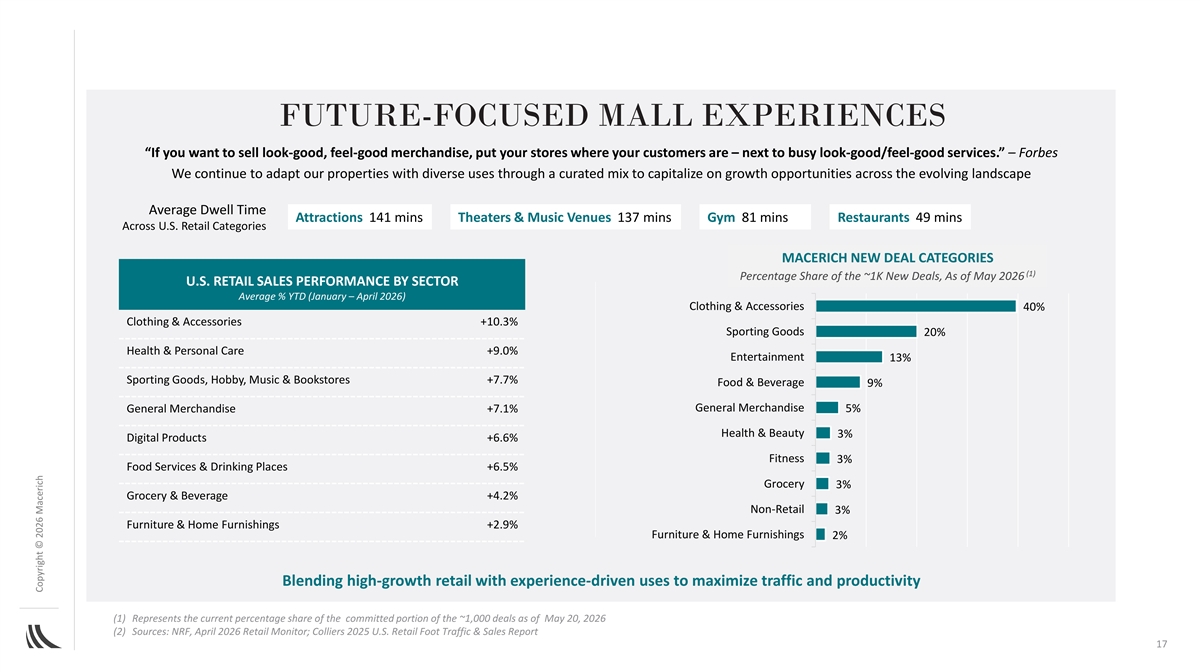
FUTURE-FOCUSED MALL EXPERIENCES “If you want to sell look-good, feel-good merchandise, put your stores where your customers are – next to busy look-good/feel-good services.” – Forbes We continue to adapt our properties with diverse uses through a curated mix to capitalize on growth opportunities across the evolving landscape Average Dwell Time Attractions 141 mins Theaters & Music Venues 137 mins Gym 81 mins Restaurants 49 mins Across U.S. Retail Categories MACERICH NEW DEAL CATEGORIES (1) Percentage Share of the ~1K New Deals, As of May 2026 U.S. RETAIL SALES PERFORMANCE BY SECTOR Average % YTD (January – April 2026) Clothing & Accessories 40% Clothing & Accessories +10.3% Sporting Goods 20% Health & Personal Care +9.0% Entertainment 13% Sporting Goods, Hobby, Music & Bookstores +7.7% Food & Beverage 9% General Merchandise 5% General Merchandise +7.1% Health & Beauty 3% Digital Products +6.6% Fitness 3% Food Services & Drinking Places +6.5% Grocery 3% Grocery & Beverage +4.2% Non-Retail 3% Furniture & Home Furnishings +2.9% Furniture & Home Furnishings 2% Blending high-growth retail with experience-driven uses to maximize traffic and productivity (1) Represents the current percentage share of the committed portion of the ~1,000 deals as of May 20, 2026 (2) Sources: NRF, April 2026 Retail Monitor; Colliers 2025 U.S. Retail Foot Traffic & Sales Report 17 Copyright © 2026 Macerich
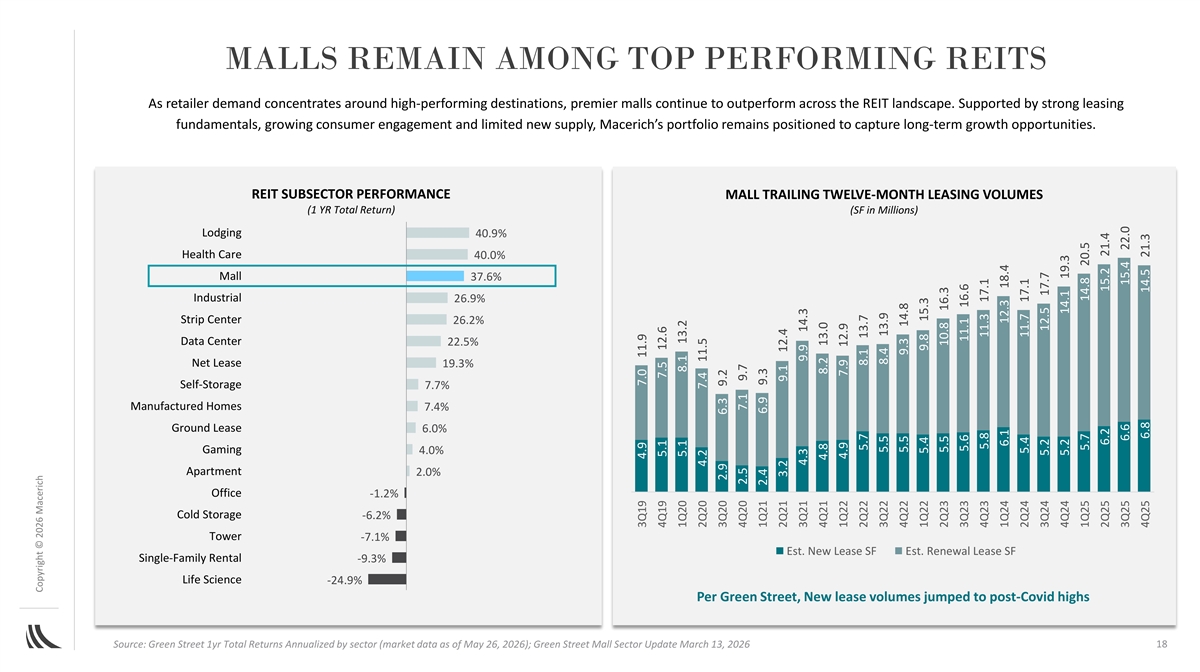
MALLS REMAIN AMONG TOP PERFORMING REITS As retailer demand concentrates around high-performing destinations, premier malls continue to outperform across the REIT landscape. Supported by strong leasing fundamentals, growing consumer engagement and limited new supply, Macerich’s portfolio remains positioned to capture long-term growth opportunities. REIT SUBSECTOR PERFORMANCE MALL TRAILING TWELVE-MONTH LEASING VOLUMES (1 YR Total Return) (SF in Millions) Lodging 40.9% Health Care 40.0% Mall 37.6% Industrial 26.9% Strip Center 26.2% Data Center 22.5% Net Lease 19.3% Self-Storage 7.7% Manufactured Homes 7.4% Ground Lease 6.0% Gaming 4.0% Apartment 2.0% Office -1.2% Cold Storage -6.2% Tower -7.1% Est. New Lease SF Est. Renewal Lease SF Single-Family Rental -9.3% Life Science -24.9% Per Green Street, New lease volumes jumped to post-Covid highs 18 Source: Green Street 1yr Total Returns Annualized by sector (market data as of May 26, 2026); Green Street Mall Sector Update March 13, 2026 Copyright © 2026 Macerich 3Q19 4.9 7.0 11.9 4Q19 5.1 7.5 12.6 1Q20 5.1 8.1 13.2 2Q20 4.2 7.4 11.5 3Q20 2.9 6.3 9.2 4Q20 2.5 7.1 9.7 1Q21 2.4 6.9 9.3 2Q21 3.2 9.1 12.4 3Q21 4.3 9.9 14.3 4Q21 4.8 8.2 13.0 1Q22 4.9 7.9 12.9 2Q22 5.7 8.1 13.7 3Q22 5.5 8.4 13.9 4Q22 5.5 9.3 14.8 1Q22 5.4 9.8 15.3 2Q23 5.5 10.8 16.3 3Q23 5.6 11.1 16.6 4Q23 5.8 11.3 17.1 1Q24 6.1 12.3 18.4 2Q24 5.4 11.7 17.1 3Q24 5.2 12.5 17.7 4Q24 5.2 14.1 19.3 1Q25 5.7 14.8 20.5 2Q25 6.2 15.2 21.4 3Q25 6.6 15.4 22.0 4Q25 6.8 14.5 21.3
PATH FORWARD PLAN v 3.0 19 FlatIron Crossing | Broomfield, CO
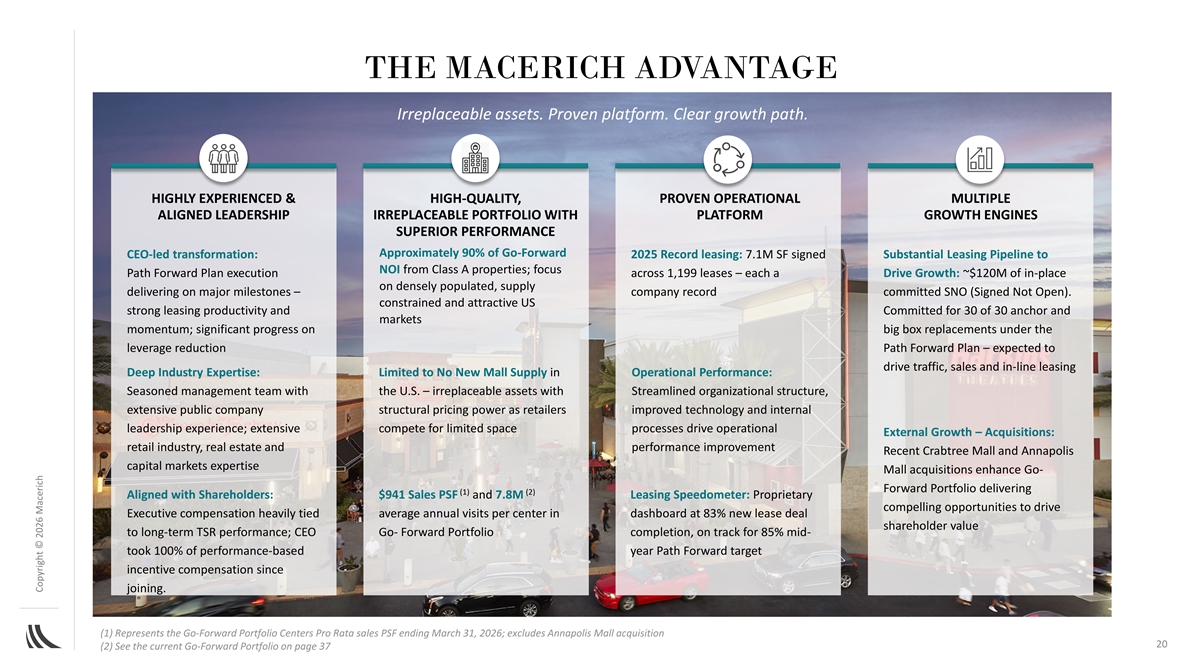
THE MACERICH ADVANTAGE Irreplaceable assets. Proven platform. Clear growth path. HIGHLY EXPERIENCED & HIGH-QUALITY, PROVEN OPERATIONAL MULTIPLE ALIGNED LEADERSHIP IRREPLACEABLE PORTFOLIO WITH PLATFORM GROWTH ENGINES SUPERIOR PERFORMANCE Approximately 90% of Go-Forward CEO-led transformation: 2025 Record leasing: 7.1M SF signed Substantial Leasing Pipeline to NOI from Class A properties; focus Path Forward Plan execution across 1,199 leases – each a Drive Growth: ~$120M of in-place on densely populated, supply delivering on major milestones – company record committed SNO (Signed Not Open). constrained and attractive US strong leasing productivity and Committed for 30 of 30 anchor and markets momentum; significant progress on big box replacements under the leverage reduction Path Forward Plan – expected to drive traffic, sales and in-line leasing Deep Industry Expertise: Limited to No New Mall Supply in Operational Performance: Seasoned management team with the U.S. – irreplaceable assets with Streamlined organizational structure, extensive public company structural pricing power as retailers improved technology and internal leadership experience; extensive compete for limited space processes drive operational External Growth – Acquisitions: retail industry, real estate and performance improvement Recent Crabtree Mall and Annapolis capital markets expertise Mall acquisitions enhance Go- Forward Portfolio delivering (1) (2) Aligned with Shareholders: $941 Sales PSF and 7.8M Leasing Speedometer: Proprietary compelling opportunities to drive Executive compensation heavily tied average annual visits per center in dashboard at 83% new lease deal shareholder value to long-term TSR performance; CEO Go- Forward Portfolio completion, on track for 85% mid- took 100% of performance-based year Path Forward target incentive compensation since joining. (1) Represents the Go-Forward Portfolio Centers Pro Rata sales PSF ending March 31, 2026; excludes Annapolis Mall acquisition 20 (2) See the current Go-Forward Portfolio on page 37 9 Copyright © 2026 Macerich
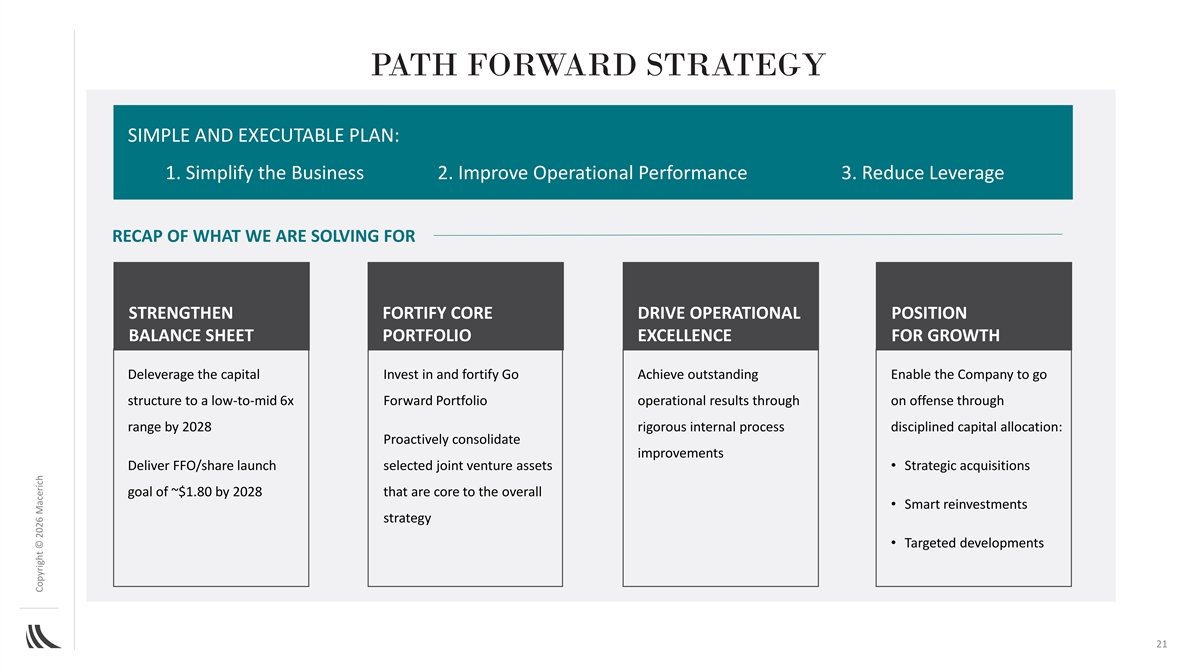
PATH FORWARD STRATEGY SIMPLE AND EXECUTABLE PLAN: 1. Simplify the Business 2. Improve Operational Performance 3. Reduce Leverage RECAP OF WHAT WE ARE SOLVING FOR STRENGTHEN FORTIFY CORE DRIVE OPERATIONAL POSITION BALANCE SHEET PORTFOLIO EXCELLENCE FOR GROWTH Deleverage the capital Invest in and fortify Go Achieve outstanding Enable the Company to go structure to a low-to-mid 6x Forward Portfolio operational results through on offense through range by 2028 rigorous internal process disciplined capital allocation: Proactively consolidate improvements Deliver FFO/share launch selected joint venture assets • Strategic acquisitions goal of ~$1.80 by 2028 that are core to the overall • Smart reinvestments strategy • Targeted developments 21 Copyright © 2026 Macerich
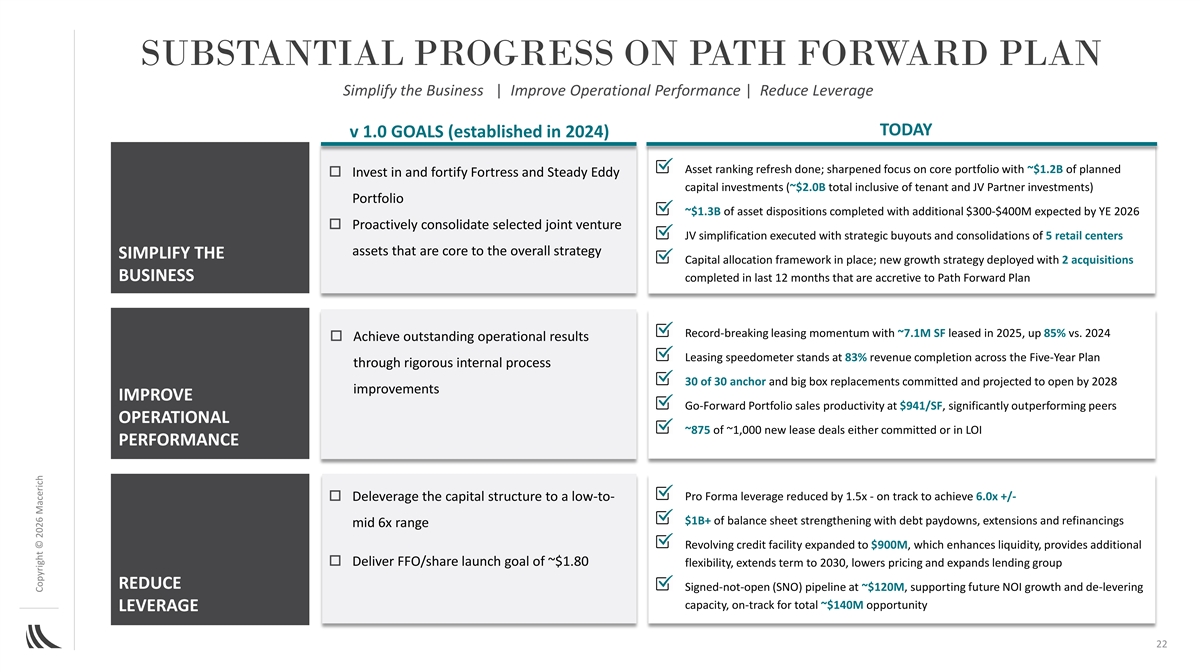
SUBSTANTIAL PROGRESS ON PATH FORWARD PLAN Simplify the Business | Improve Operational Performance | Reduce Leverage TODAY v 1.0 GOALS (established in 2024) Asset ranking refresh done; sharpened focus on core portfolio with ~$1.2B of planned o Invest in and fortify Fortress and Steady Eddy capital investments (~$2.0B total inclusive of tenant and JV Partner investments) Portfolio ~$1.3B of asset dispositions completed with additional $300-$400M expected by YE 2026 o Proactively consolidate selected joint venture JV simplification executed with strategic buyouts and consolidations of 5 retail centers assets that are core to the overall strategy SIMPLIFY THE Capital allocation framework in place; new growth strategy deployed with 2 acquisitions BUSINESS completed in last 12 months that are accretive to Path Forward Plan Record-breaking leasing momentum with ~7.1M SF leased in 2025, up 85% vs. 2024 o Achieve outstanding operational results Leasing speedometer stands at 83% revenue completion across the Five-Year Plan through rigorous internal process 30 of 30 anchor and big box replacements committed and projected to open by 2028 improvements IMPROVE Go-Forward Portfolio sales productivity at $941/SF, significantly outperforming peers OPERATIONAL ~875 of ~1,000 new lease deals either committed or in LOI PERFORMANCE Pro Forma leverage reduced by 1.5x - on track to achieve 6.0x +/- o Deleverage the capital structure to a low-to- $1B+ of balance sheet strengthening with debt paydowns, extensions and refinancings mid 6x range Revolving credit facility expanded to $900M, which enhances liquidity, provides additional o Deliver FFO/share launch goal of ~$1.80 flexibility, extends term to 2030, lowers pricing and expands lending group REDUCE Signed-not-open (SNO) pipeline at ~$120M, supporting future NOI growth and de-levering capacity, on-track for total ~$140M opportunity LEVERAGE 22 Copyright © 2026 Macerich
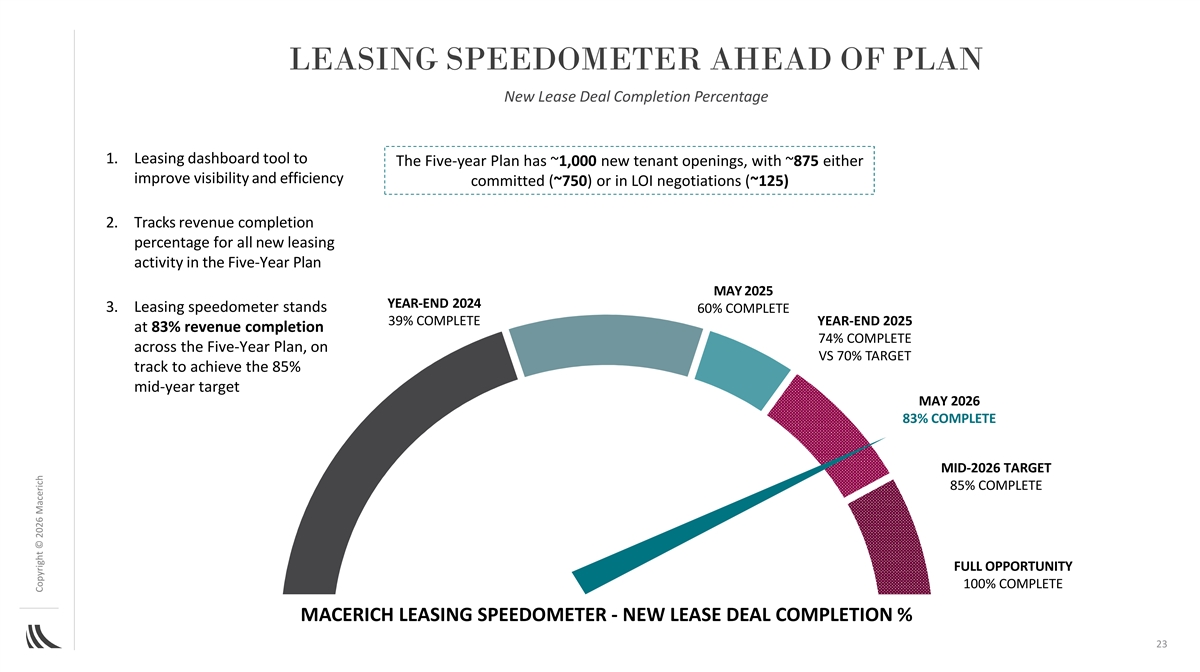
LEASING SPEEDOMETER AHEAD OF PLAN New Lease Deal Completion Percentage 1. Leasing dashboard tool to The Five-year Plan has ~1,000 new tenant openings, with ~875 either improve visibility and efficiency committed (~750) or in LOI negotiations (~125) 2. Tracks revenue completion percentage for all new leasing activity in the Five-Year Plan MAY 2025 YEAR-END 2024 3. Leasing speedometer stands 60% COMPLETE 39% COMPLETE YEAR-END 2025 at 83% revenue completion 74% COMPLETE across the Five-Year Plan, on VS 70% TARGET track to achieve the 85% mid-year target MAY 2026 83% COMPLETE MID-2026 TARGET 85% COMPLETE FULL OPPORTUNITY 100% COMPLETE MACERICH LEASING SPEEDOMETER - NEW LEASE DEAL COMPLETION % 23 Copyright © 2026 Macerich
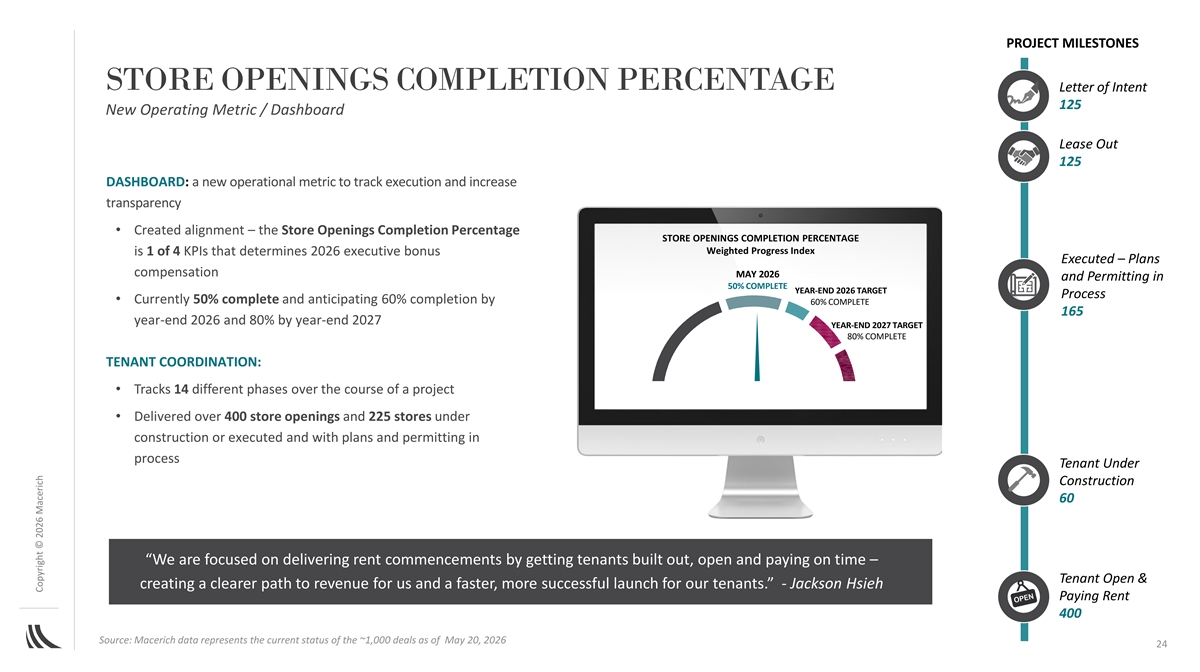
PROJECT MILESTONES STORE OPENINGS COMPLETION PERCENTAGE Letter of Intent 125 New Operating Metric / Dashboard Lease Out 125 DASHBOARD: a new operational metric to track execution and increase transparency • Created alignment – the Store Openings Completion Percentage STORE OPENINGS COMPLETION PERCENTAGE Weighted Progress Index is 1 of 4 KPIs that determines 2026 executive bonus Executed – Plans compensation MAY 2026 and Permitting in 50% COMPLETE YEAR-END 2026 TARGET Process • Currently 50% complete and anticipating 60% completion by 60% COMPLETE 165 year-end 2026 and 80% by year-end 2027 YEAR-END 2027 TARGET 80% COMPLETE TENANT COORDINATION: • Tracks 14 different phases over the course of a project • Delivered over 400 store openings and 225 stores under construction or executed and with plans and permitting in process Tenant Under Construction 60 “We are focused on delivering rent commencements by getting tenants built out, open and paying on time – Tenant Open & creating a clearer path to revenue for us and a faster, more successful launch for our tenants.” - Jackson Hsieh Paying Rent 400 Source: Macerich data represents the current status of the ~1,000 deals as of May 20, 2026 24 Copyright © 2026 Macerich
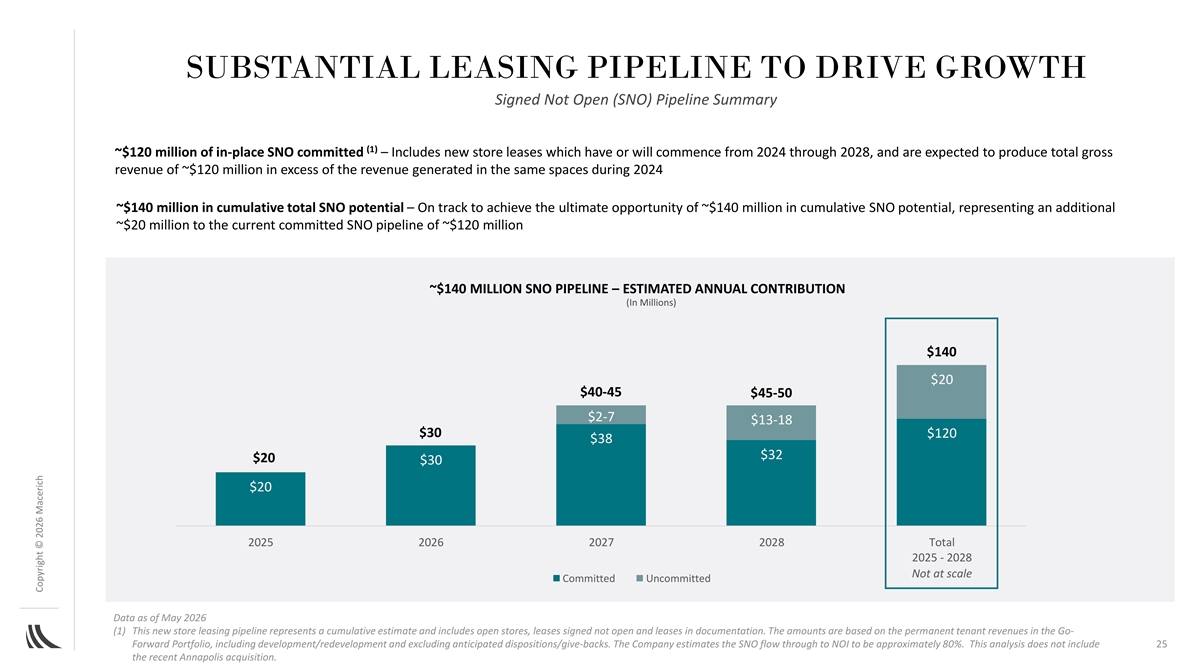
SUBSTANTIAL LEASING PIPELINE TO DRIVE GROWTH Signed Not Open (SNO) Pipeline Summary (1) ~$120 million of in-place SNO committed – Includes new store leases which have or will commence from 2024 through 2028, and are expected to produce total gross revenue of ~$120 million in excess of the revenue generated in the same spaces during 2024 ~$140 million in cumulative total SNO potential – On track to achieve the ultimate opportunity of ~$140 million in cumulative SNO potential, representing an additional ~$20 million to the current committed SNO pipeline of ~$120 million ~$140 MILLION SNO PIPELINE – ESTIMATED ANNUAL CONTRIBUTION (In Millions) $140 $20 $40-45 $45-50 $2-7 $13-18 $30 $120 $38 $32 $20 $30 $20 2025 2026 2027 2028 Total 2025 - 2028 Not at scale Committed Uncommitted Data as of May 2026 (1) This new store leasing pipeline represents a cumulative estimate and includes open stores, leases signed not open and leases in documentation. The amounts are based on the permanent tenant revenues in the Go- Forward Portfolio, including development/redevelopment and excluding anticipated dispositions/give-backs. The Company estimates the SNO flow through to NOI to be approximately 80%. This analysis does not include 25 the recent Annapolis acquisition. Copyright © 2026 Macerich
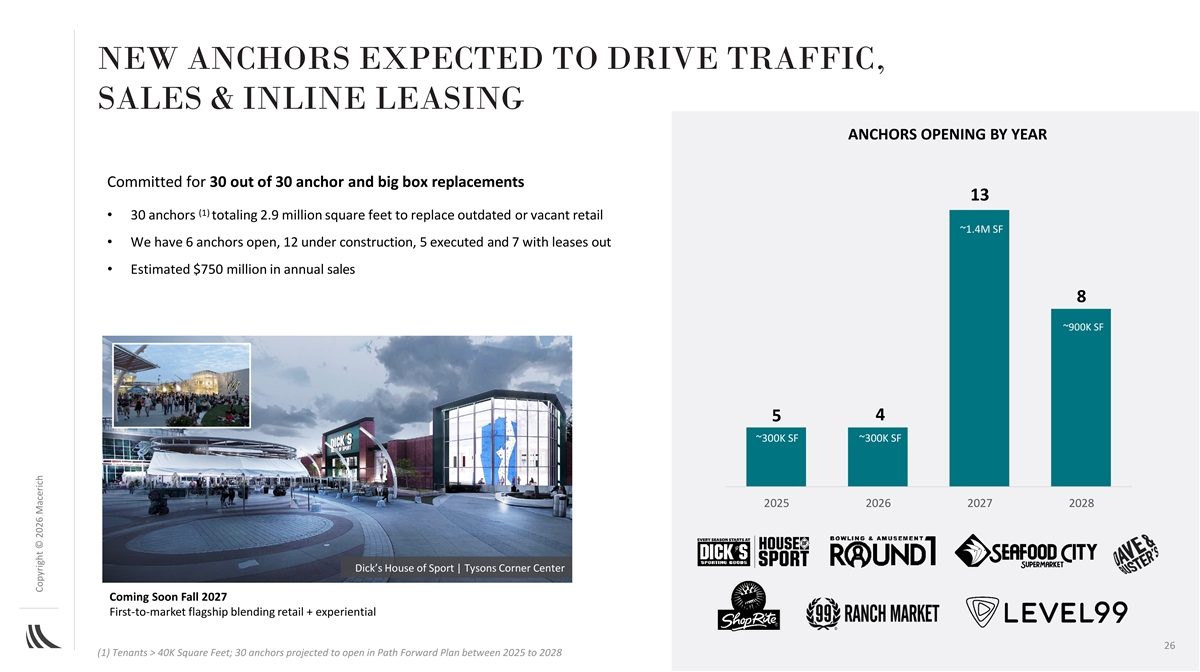
NEW ANCHORS EXPECTED TO DRIVE TRAFFIC, SALES & INLINE LEASING ANCHORS OPENING BY YEAR Committed for 30 out of 30 anchor and big box replacements 13 (1) • 30 anchors totaling 2.9 million square feet to replace outdated or vacant retail ~1.4M SF • We have 6 anchors open, 12 under construction, 5 executed and 7 with leases out • Estimated $750 million in annual sales 8 ~900K SF 4 5 ~300K SF ~300K SF 2025 2026 2027 2028 Dick’s House of Sport | Tysons Corner Center Coming Soon Fall 2027 First-to-market flagship blending retail + experiential 26 (1) Tenants > 40K Square Feet; 30 anchors projected to open in Path Forward Plan between 2025 to 2028 Copyright © 2026 Macerich
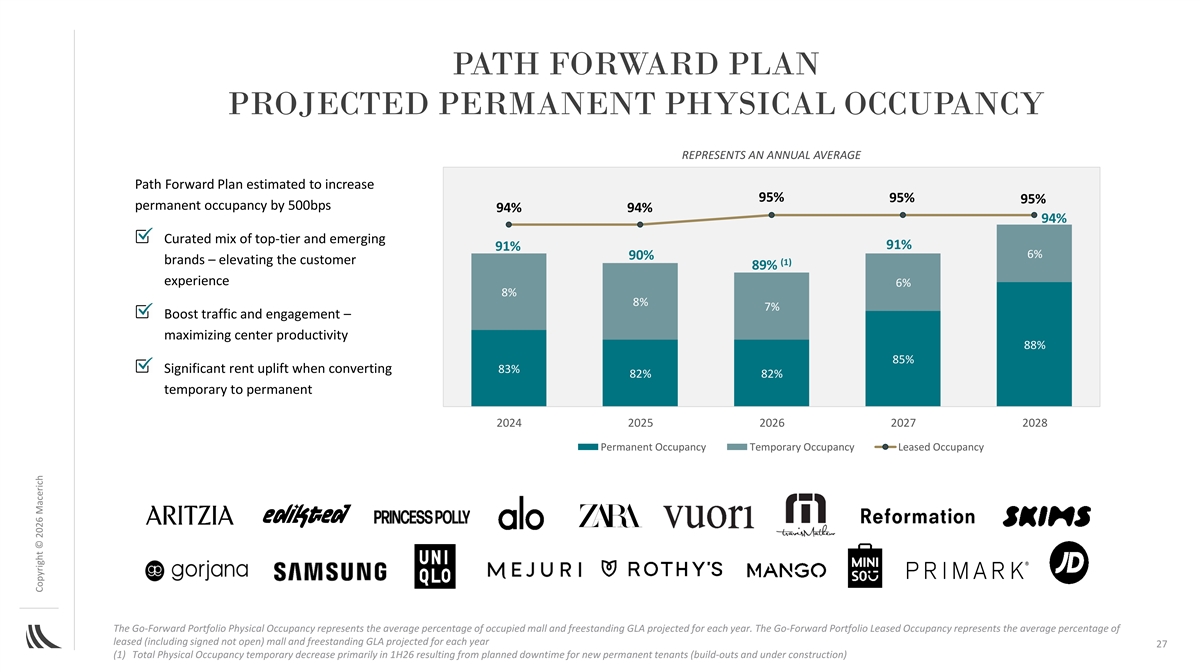
PATH FORWARD PLAN PROJECTED PERMANENT PHYSICAL OCCUPANCY REPRESENTS AN ANNUAL AVERAGE Path Forward Plan estimated to increase 95% 95% 95% permanent occupancy by 500bps 94% 94% 94% Curated mix of top-tier and emerging 91% 91% 6% 90% brands – elevating the customer (1) 89% experience 6% 8% 8% 7% Boost traffic and engagement – maximizing center productivity 88% 85% Significant rent uplift when converting 83% 82% 82% temporary to permanent 2024 2025 2026 2027 2028 Permanent Occupancy Temporary Occupancy Leased Occupancy The Go-Forward Portfolio Physical Occupancy represents the average percentage of occupied mall and freestanding GLA projected for each year. The Go-Forward Portfolio Leased Occupancy represents the average percentage of leased (including signed not open) mall and freestanding GLA projected for each year 27 (1) Total Physical Occupancy temporary decrease primarily in 1H26 resulting from planned downtime for new permanent tenants (build-outs and under construction) Copyright © 2026 Macerich
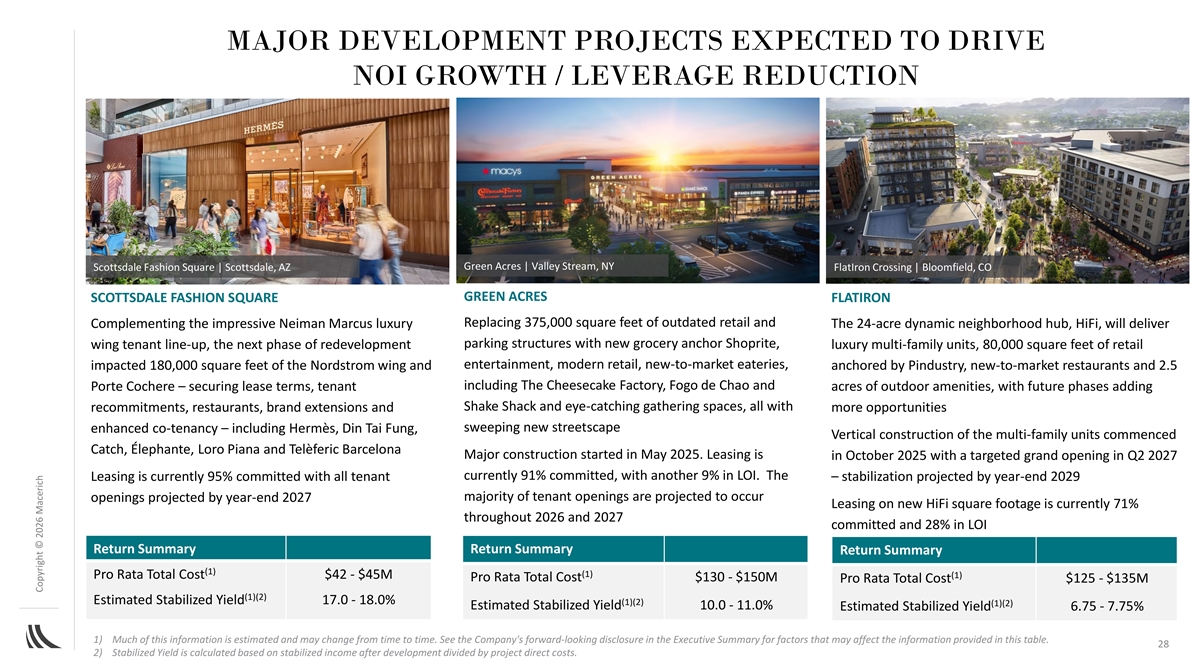
MAJOR DEVELOPMENT PROJECTS EXPECTED TO DRIVE NOI GROWTH / LEVERAGE REDUCTION Green Acres | Valley Stream, NY Scottsdale Fashion Square | Scottsdale, AZ FlatIron Crossing | Bloomfield, CO GREEN ACRES SCOTTSDALE FASHION SQUARE FLATIRON Replacing 375,000 square feet of outdated retail and Complementing the impressive Neiman Marcus luxury The 24-acre dynamic neighborhood hub, HiFi, will deliver parking structures with new grocery anchor Shoprite, wing tenant line-up, the next phase of redevelopment luxury multi-family units, 80,000 square feet of retail entertainment, modern retail, new-to-market eateries, impacted 180,000 square feet of the Nordstrom wing and anchored by Pindustry, new-to-market restaurants and 2.5 including The Cheesecake Factory, Fogo de Chao and Porte Cochere – securing lease terms, tenant acres of outdoor amenities, with future phases adding Shake Shack and eye-catching gathering spaces, all with recommitments, restaurants, brand extensions and more opportunities sweeping new streetscape enhanced co-tenancy – including Hermès, Din Tai Fung, Vertical construction of the multi-family units commenced Catch, Élephante, Loro Piana and Telèferic Barcelona Major construction started in May 2025. Leasing is in October 2025 with a targeted grand opening in Q2 2027 currently 91% committed, with another 9% in LOI. The Leasing is currently 95% committed with all tenant – stabilization projected by year-end 2029 majority of tenant openings are projected to occur openings projected by year-end 2027 Leasing on new HiFi square footage is currently 71% throughout 2026 and 2027 committed and 28% in LOI Return Summary Return Summary Return Summary (1) (1) Pro Rata Total Cost $42 - $45M (1) Pro Rata Total Cost $130 - $150M Pro Rata Total Cost $125 - $135M (1)(2) Estimated Stabilized Yield 17.0 - 18.0% (1)(2) (1)(2) Estimated Stabilized Yield 10.0 - 11.0% Estimated Stabilized Yield 6.75 - 7.75% 1) Much of this information is estimated and may change from time to time. See the Company's forward-looking disclosure in the Executive Summary for factors that may affect the information provided in this table. 28 2) Stabilized Yield is calculated based on stabilized income after development divided by project direct costs. Copyright © 2026 Macerich
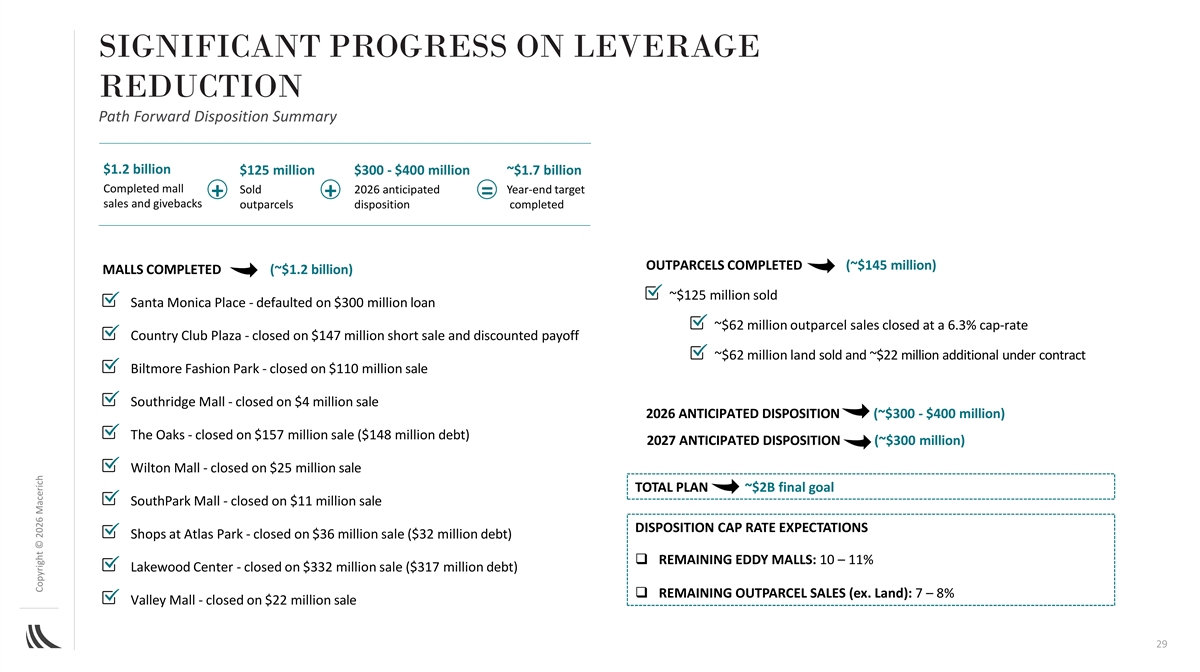
SIGNIFICANT PROGRESS ON LEVERAGE Pro Forma leverage reduced by REDUCTION 1.5x - on track to achieve +/- 6.0x Path Forward Disposition Summary $1.2 billion $125 million $300 - $400 million ~$1.7 billion Completed mall Sold 2026 anticipated Year-end target + + = sales and givebacks outparcels disposition completed OUTPARCELS COMPLETED (~$145 million) MALLS COMPLETED (~$1.2 billion) ~$125 million sold Santa Monica Place - defaulted on $300 million loan ~$62 million outparcel sales closed at a 6.3% cap-rate Country Club Plaza - closed on $147 million short sale and discounted payoff ~$62 million land sold and ~$22 million additional under contract Biltmore Fashion Park - closed on $110 million sale Southridge Mall - closed on $4 million sale 2026 ANTICIPATED DISPOSITION (~$300 - $400 million) The Oaks - closed on $157 million sale ($148 million debt) 2027 ANTICIPATED DISPOSITION (~$300 million) Wilton Mall - closed on $25 million sale TOTAL PLAN ~$2B final goal SouthPark Mall - closed on $11 million sale DISPOSITION CAP RATE EXPECTATIONS Shops at Atlas Park - closed on $36 million sale ($32 million debt) q REMAINING EDDY MALLS: 10 – 11% Lakewood Center - closed on $332 million sale ($317 million debt) q REMAINING OUTPARCEL SALES (ex. Land): 7 – 8% Valley Mall - closed on $22 million sale 29 Copyright © 2026 Macerich
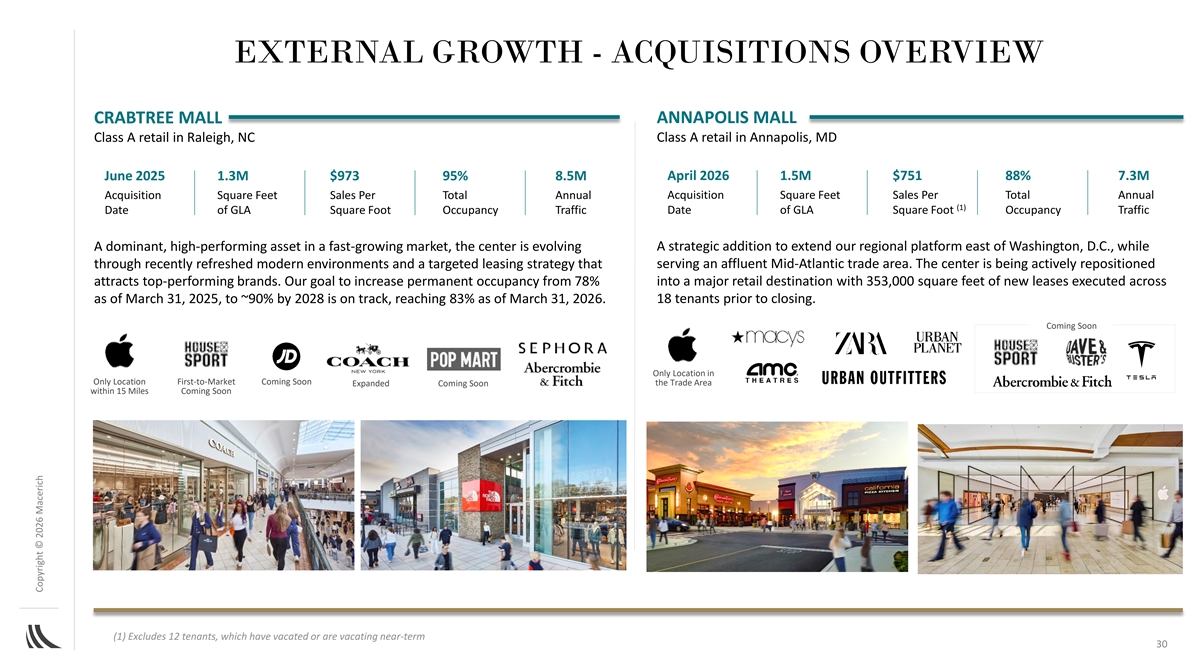
EXTERNAL GROWTH - ACQUISITIONS OVERVIEW ANNAPOLIS MALL CRABTREE MALL Class A retail in Raleigh, NC Class A retail in Annapolis, MD June 2025 1.3M $973 95% 8.5M April 2026 1.5M $751 88% 7.3M Acquisition Square Feet Sales Per Total Annual Acquisition Square Feet Sales Per Total Annual (1) Date of GLA Square Foot Occupancy Traffic Date of GLA Square Foot Occupancy Traffic A dominant, high-performing asset in a fast-growing market, the center is evolving A strategic addition to extend our regional platform east of Washington, D.C., while through recently refreshed modern environments and a targeted leasing strategy that serving an affluent Mid-Atlantic trade area. The center is being actively repositioned attracts top-performing brands. Our goal to increase permanent occupancy from 78% into a major retail destination with 353,000 square feet of new leases executed across as of March 31, 2025, to ~90% by 2028 is on track, reaching 83% as of March 31, 2026. 18 tenants prior to closing. Coming Soon Only Location in Only Location First-to-Market Coming Soon Expanded Coming Soon the Trade Area within 15 Miles Coming Soon (1) Excludes 12 tenants, which have vacated or are vacating near-term 30 Copyright © 2026 Macerich
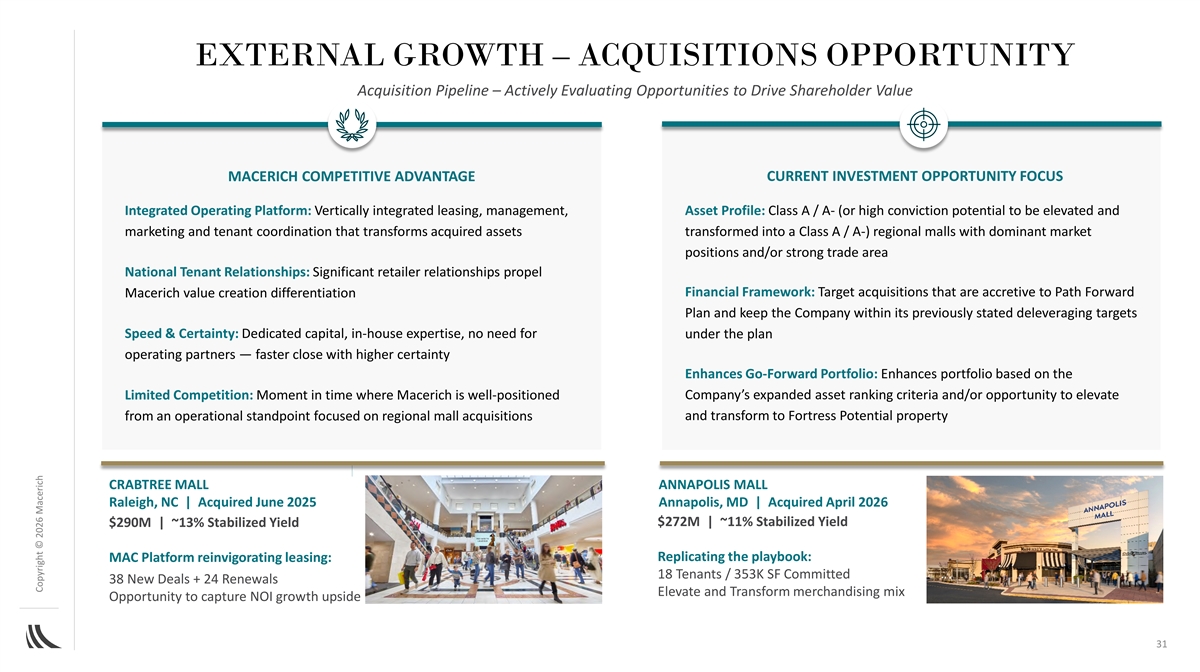
EXTERNAL GROWTH – ACQUISITIONS OPPORTUNITY Acquisition Pipeline – Actively Evaluating Opportunities to Drive Shareholder Value MACERICH COMPETITIVE ADVANTAGE CURRENT INVESTMENT OPPORTUNITY FOCUS Integrated Operating Platform: Vertically integrated leasing, management, Asset Profile: Class A / A- (or high conviction potential to be elevated and marketing and tenant coordination that transforms acquired assets transformed into a Class A / A-) regional malls with dominant market positions and/or strong trade area National Tenant Relationships: Significant retailer relationships propel Financial Framework: Target acquisitions that are accretive to Path Forward Macerich value creation differentiation Plan and keep the Company within its previously stated deleveraging targets Speed & Certainty: Dedicated capital, in-house expertise, no need for under the plan operating partners — faster close with higher certainty Enhances Go-Forward Portfolio: Enhances portfolio based on the Limited Competition: Moment in time where Macerich is well-positioned Company’s expanded asset ranking criteria and/or opportunity to elevate from an operational standpoint focused on regional mall acquisitions and transform to Fortress Potential property Underwriting Investment Committee CRABTREE MALL ANNAPOLIS MALL Raleigh, NC | Acquired June 2025 Annapolis, MD | Acquired April 2026 $272M | ~11% Stabilized Yield $290M | ~13% Stabilized Yield Replicating the playbook: MAC Platform reinvigorating leasing: 18 Tenants / 353K SF Committed 38 New Deals + 24 Renewals Elevate and Transform merchandising mix Opportunity to capture NOI growth upside 31 Copyright © 2026 Macerich

ELEVATE & TRANSFORM CASE STUDIES 32 Annapolis Mall | Annapolis, MD
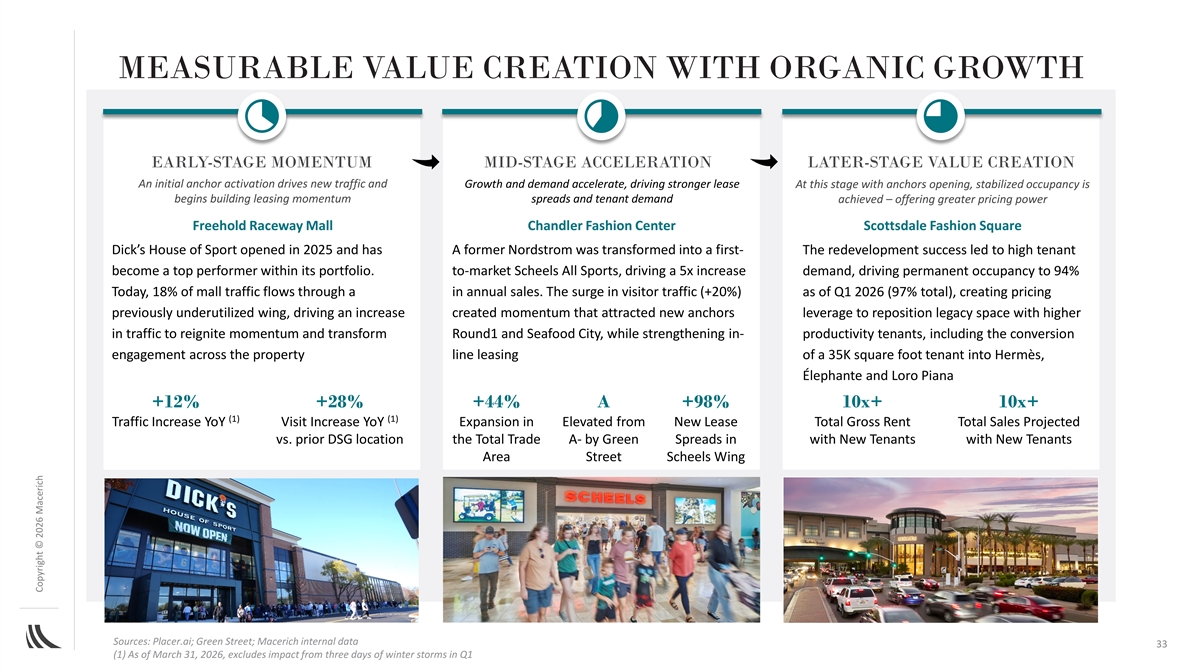
MEASURABLE VALUE CREATION WITH ORGANIC GROWTH EARLY-STAGE MOMENTUM MID-STAGE ACCELERATION LATER-STAGE VALUE CREATION An initial anchor activation drives new traffic and Growth and demand accelerate, driving stronger lease At this stage with anchors opening, stabilized occupancy is begins building leasing momentum spreads and tenant demand achieved – offering greater pricing power Freehold Raceway Mall Chandler Fashion Center Scottsdale Fashion Square Dick’s House of Sport opened in 2025 and has A former Nordstrom was transformed into a first- The redevelopment success led to high tenant become a top performer within its portfolio. to-market Scheels All Sports, driving a 5x increase demand, driving permanent occupancy to 94% Today, 18% of mall traffic flows through a in annual sales. The surge in visitor traffic (+20%) as of Q1 2026 (97% total), creating pricing previously underutilized wing, driving an increase created momentum that attracted new anchors leverage to reposition legacy space with higher in traffic to reignite momentum and transform Round1 and Seafood City, while strengthening in- productivity tenants, including the conversion engagement across the property line leasing of a 35K square foot tenant into Hermès, Élephante and Loro Piana +12% +28% +44% A +98% 10x+ 10x+ (1) (1) Traffic Increase YoY Visit Increase YoY Expansion in Elevated from New Lease Total Gross Rent Total Sales Projected vs. prior DSG location the Total Trade A- by Green Spreads in with New Tenants with New Tenants Area Street Scheels Wing Sources: Placer.ai; Green Street; Macerich internal data 33 (1) As of March 31, 2026, excludes impact from three days of winter storms in Q1 Copyright © 2026 Macerich
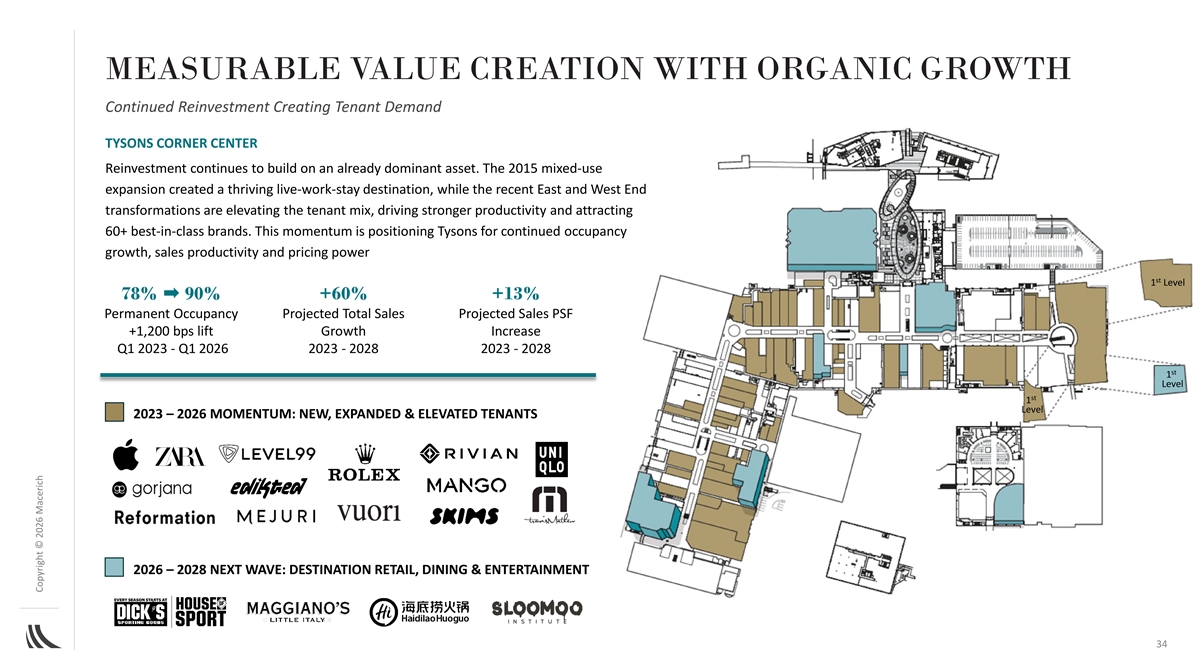
MEASURABLE VALUE CREATION WITH ORGANIC GROWTH Continued Reinvestment Creating Tenant Demand TYSONS CORNER CENTER Reinvestment continues to build on an already dominant asset. The 2015 mixed-use expansion created a thriving live-work-stay destination, while the recent East and West End transformations are elevating the tenant mix, driving stronger productivity and attracting 60+ best-in-class brands. This momentum is positioning Tysons for continued occupancy growth, sales productivity and pricing power st 1 Level 78% 90% +60% +13% Permanent Occupancy Projected Total Sales Projected Sales PSF +1,200 bps lift Growth Increase Q1 2023 - Q1 2026 2023 - 2028 2023 - 2028 st 1 Level st 1 Level 2023 – 2026 MOMENTUM: NEW, EXPANDED & ELEVATED TENANTS 2026 – 2028 NEXT WAVE: DESTINATION RETAIL, DINING & ENTERTAINMENT 34 Copyright © 2026 Macerich
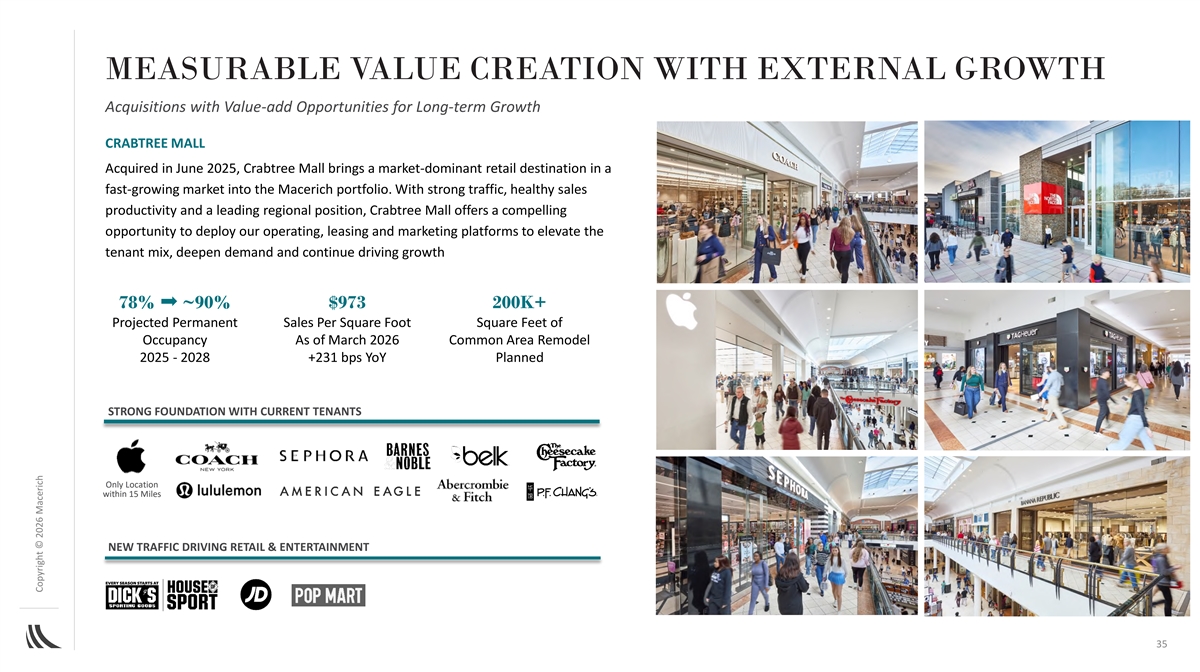
MEASURABLE VALUE CREATION WITH EXTERNAL GROWTH Acquisitions with Value-add Opportunities for Long-term Growth CRABTREE MALL Acquired in June 2025, Crabtree Mall brings a market-dominant retail destination in a fast-growing market into the Macerich portfolio. With strong traffic, healthy sales productivity and a leading regional position, Crabtree Mall offers a compelling opportunity to deploy our operating, leasing and marketing platforms to elevate the tenant mix, deepen demand and continue driving growth 78% ~90% $973 200K+ Projected Permanent Sales Per Square Foot Square Feet of Occupancy As of March 2026 Common Area Remodel 2025 - 2028 +231 bps YoY Planned STRONG FOUNDATION WITH CURRENT TENANTS Only Location within 15 Miles NEW TRAFFIC DRIVING RETAIL & ENTERTAINMENT 35 Copyright © 2026 Macerich

PORTFOLIO AND FINANCIAL OVERVIEW 36 Fashion District Philadelphia | Philadelphia, PA
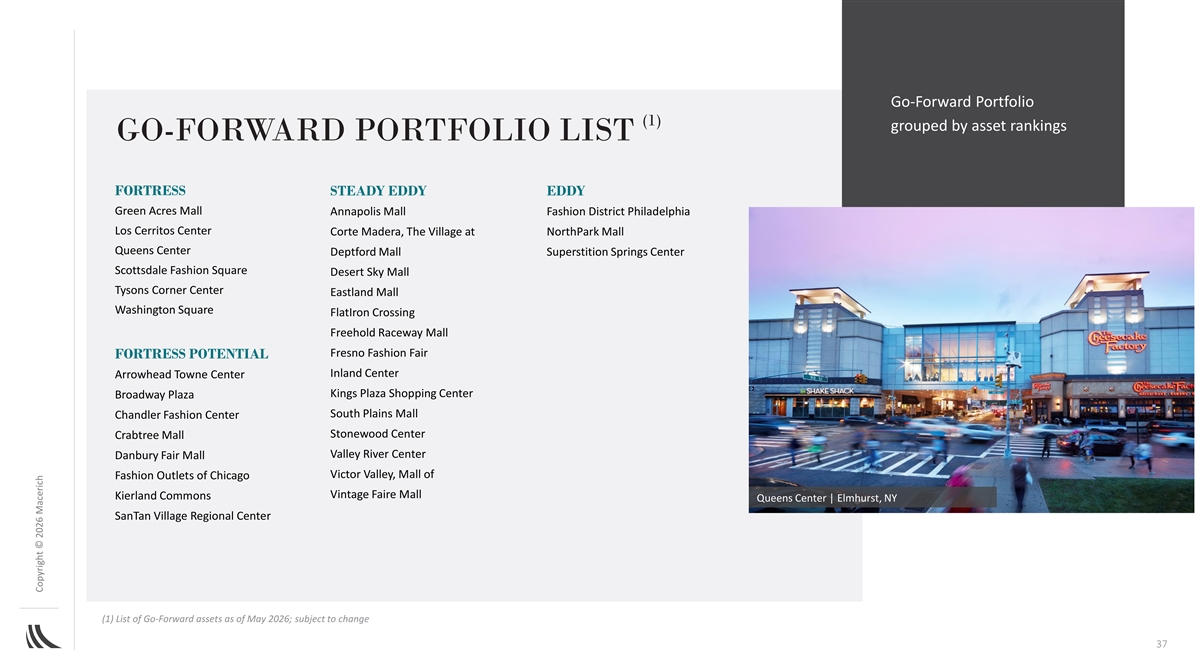
Go-Forward Portfolio (1) grouped by asset rankings GO-FORWARD PORTFOLIO LIST FORTRESS STEADY EDDY EDDY Green Acres Mall Annapolis Mall Fashion District Philadelphia Los Cerritos Center Corte Madera, The Village at NorthPark Mall Queens Center Deptford Mall Superstition Springs Center Scottsdale Fashion Square Desert Sky Mall Tysons Corner Center Eastland Mall Washington Square FlatIron Crossing Freehold Raceway Mall Fresno Fashion Fair FORTRESS POTENTIAL Inland Center Arrowhead Towne Center Kings Plaza Shopping Center Broadway Plaza South Plains Mall Chandler Fashion Center Stonewood Center Crabtree Mall Valley River Center Danbury Fair Mall Victor Valley, Mall of Fashion Outlets of Chicago Vintage Faire Mall Kierland Commons Queens Center | Elmhurst, NY SanTan Village Regional Center (1) List of Go-Forward assets as of May 2026; subject to change 37 Copyright © 2026 Macerich
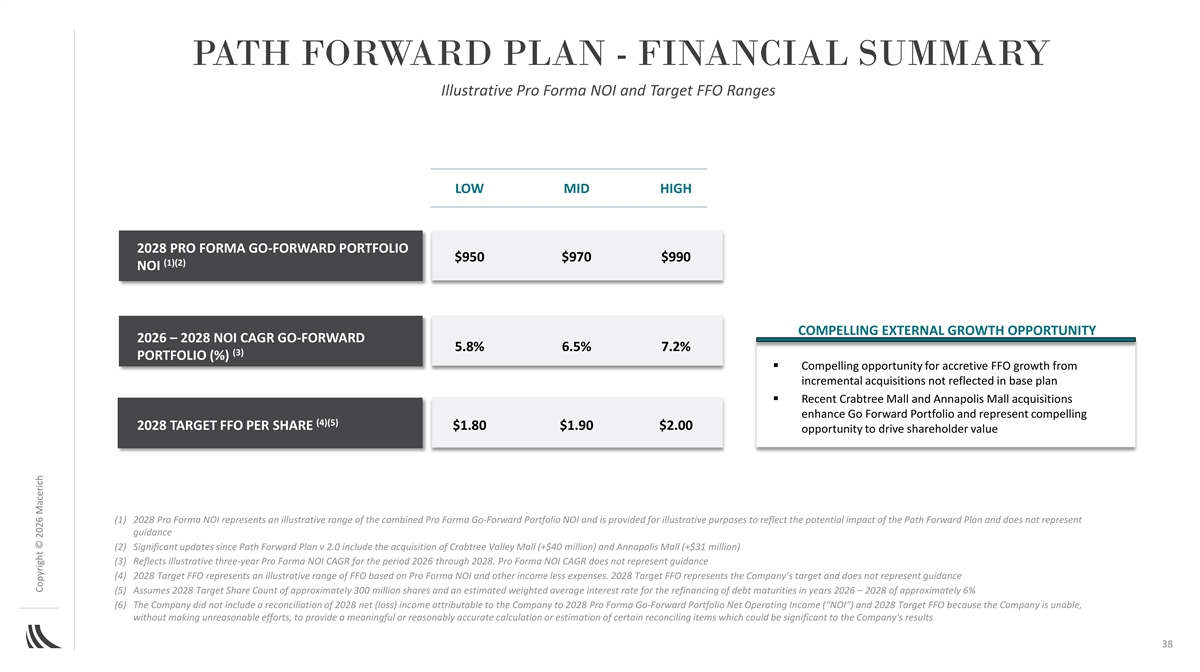
PATH FORWARD PLAN - FINANCIAL SUMMARY Illustrative Pro Forma NOI and Target FFO Ranges LOW MID HIGH 2028 PRO FORMA GO-FORWARD PORTFOLIO $950 $970 $990 (1)(2) NOI COMPELLING EXTERNAL GROWTH OPPORTUNITY 2026 – 2028 NOI CAGR GO-FORWARD 5.8% 6.5% 7.2% (3) PORTFOLIO (%) § Compelling opportunity for accretive FFO growth from incremental acquisitions not reflected in base plan § Recent Crabtree Mall and Annapolis Mall acquisitions enhance Go Forward Portfolio and represent compelling (4)(5) 2028 TARGET FFO PER SHARE $1.80 $1.90 $2.00 opportunity to drive shareholder value (1) 2028 Pro Forma NOI represents an illustrative range of the combined Pro Forma Go-Forward Portfolio NOI and is provided for illustrative purposes to reflect the potential impact of the Path Forward Plan and does not represent guidance (2) Significant updates since Path Forward Plan v 2.0 include the acquisition of Crabtree Valley Mall (+$40 million) and Annapolis Mall (+$31 million) (3) Reflects illustrative three-year Pro Forma NOI CAGR for the period 2026 through 2028. Pro Forma NOI CAGR does not represent guidance (4) 2028 Target FFO represents an illustrative range of FFO based on Pro Forma NOI and other income less expenses. 2028 Target FFO represents the Company’s target and does not represent guidance (5) Assumes 2028 Target Share Count of approximately 300 million shares and an estimated weighted average interest rate for the refinancing of debt maturities in years 2026 – 2028 of approximately 6% (6) The Company did not include a reconciliation of 2028 net (loss) income attributable to the Company to 2028 Pro Forma Go-Forward Portfolio Net Operating Income (“NOI”) and 2028 Target FFO because the Company is unable, without making unreasonable efforts, to provide a meaningful or reasonably accurate calculation or estimation of certain reconciling items which could be significant to the Company's results 38 Copyright © 2026 Macerich
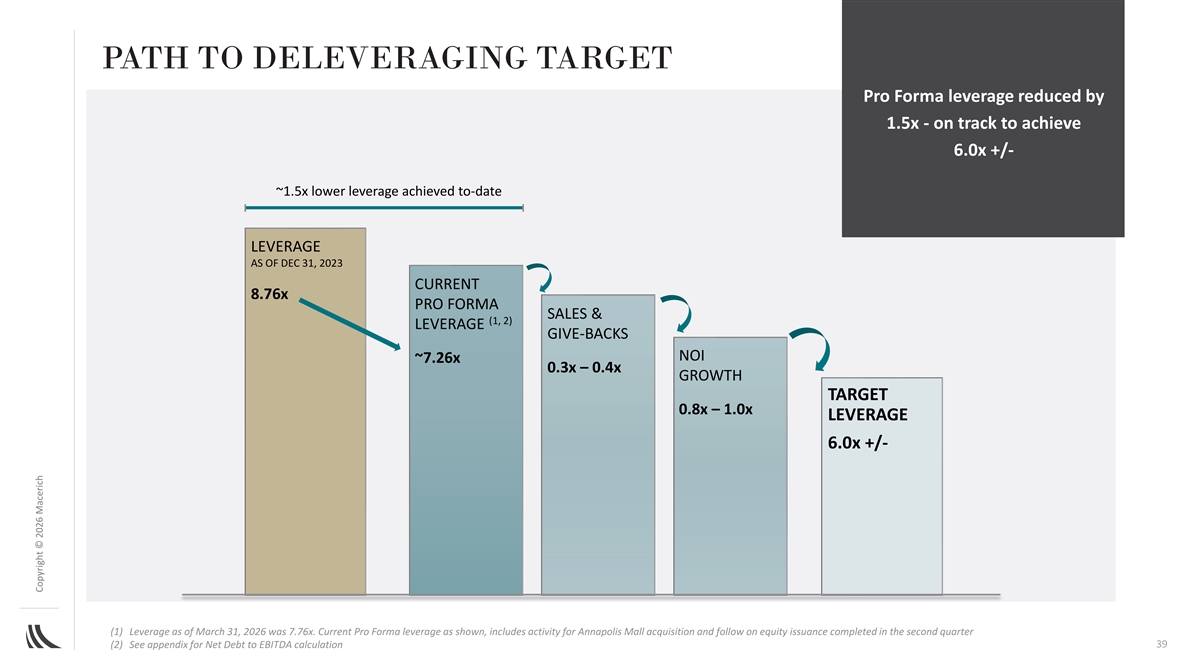
PATH TO DELEVERAGING TARGET Pro Forma leverage reduced by 1.5x - on track to achieve 6.0x +/- ~1.5x lower leverage achieved to-date LEVERAGE AS OF DEC 31, 2023 CURRENT 8.76x PRO FORMA SALES & (1, 2) LEVERAGE GIVE-BACKS NOI ~7.26x 0.3x – 0.4x GROWTH TARGET 0.8x – 1.0x LEVERAGE 6.0x +/- (1) Leverage as of March 31, 2026 was 7.76x. Current Pro Forma leverage as shown, includes activity for Annapolis Mall acquisition and follow on equity issuance completed in the second quarter 39 (2) See appendix for Net Debt to EBITDA calculation Copyright © 2026 Macerich
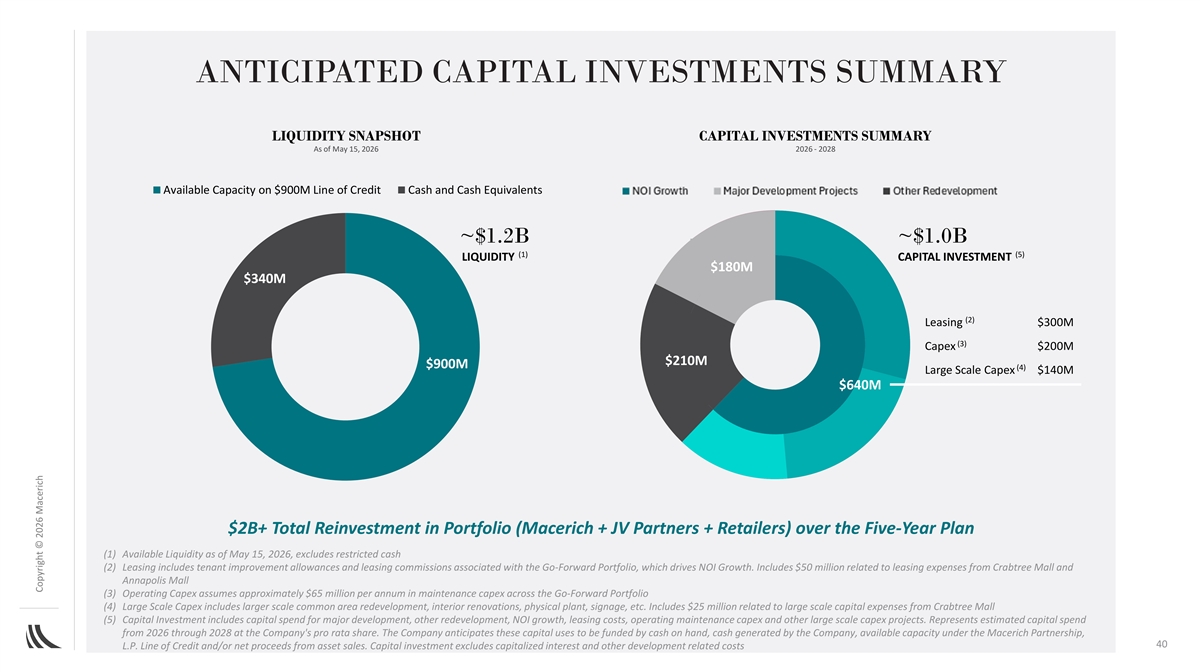
ANTICIPATED CAPITAL INVESTMENTS SUMMARY LIQUIDITY SNAPSHOT CAPITAL INVESTMENTS SUMMARY As of May 15, 2026 2026 - 2028 Available Capacity on $900M Line of Credit Cash and Cash Equivalents ~$1.2B ~$1.0B (1) (5) LIQUIDITY CAPITAL INVESTMENT $180M $340M (2) Leasing $300M (3) Capex $200M $210M $900M (4) Large Scale Capex $140M $640M $2B+ Total Reinvestment in Portfolio (Macerich + JV Partners + Retailers) over the Five-Year Plan (1) Available Liquidity as of May 15, 2026, excludes restricted cash (2) Leasing includes tenant improvement allowances and leasing commissions associated with the Go-Forward Portfolio, which drives NOI Growth. Includes $50 million related to leasing expenses from Crabtree Mall and Annapolis Mall (3) Operating Capex assumes approximately $65 million per annum in maintenance capex across the Go-Forward Portfolio (4) Large Scale Capex includes larger scale common area redevelopment, interior renovations, physical plant, signage, etc. Includes $25 million related to large scale capital expenses from Crabtree Mall (5) Capital Investment includes capital spend for major development, other redevelopment, NOI growth, leasing costs, operating maintenance capex and other large scale capex projects. Represents estimated capital spend from 2026 through 2028 at the Company's pro rata share. The Company anticipates these capital uses to be funded by cash on hand, cash generated by the Company, available capacity under the Macerich Partnership, 40 L.P. Line of Credit and/or net proceeds from asset sales. Capital investment excludes capitalized interest and other development related costs Copyright © 2026 Macerich
2028 AND BEYOND 41 Tysons Corner Center | Tysons, VA
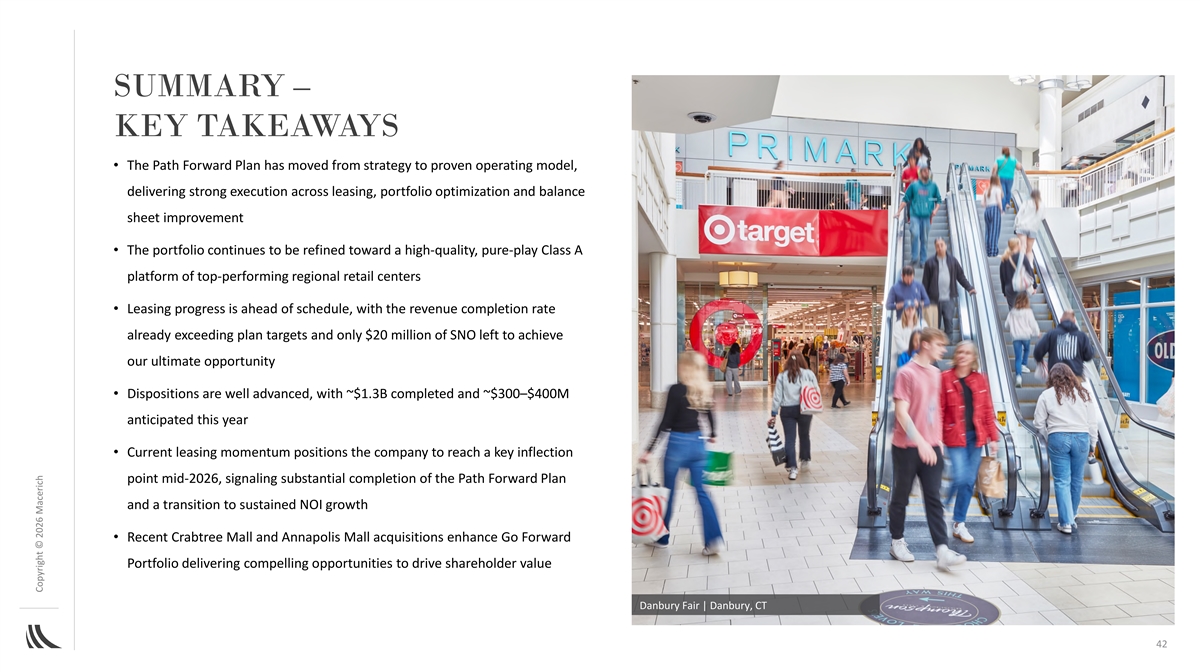
SUMMARY – KEY TAKEAWAYS • The Path Forward Plan has moved from strategy to proven operating model, delivering strong execution across leasing, portfolio optimization and balance sheet improvement • The portfolio continues to be refined toward a high-quality, pure-play Class A platform of top-performing regional retail centers • Leasing progress is ahead of schedule, with the revenue completion rate already exceeding plan targets and only $20 million of SNO left to achieve our ultimate opportunity • Dispositions are well advanced, with ~$1.3B completed and ~$300–$400M anticipated this year • Current leasing momentum positions the company to reach a key inflection point mid-2026, signaling substantial completion of the Path Forward Plan and a transition to sustained NOI growth • Recent Crabtree Mall and Annapolis Mall acquisitions enhance Go Forward Portfolio delivering compelling opportunities to drive shareholder value Danbury Fair | Danbury, CT 42 Copyright © 2026 Macerich
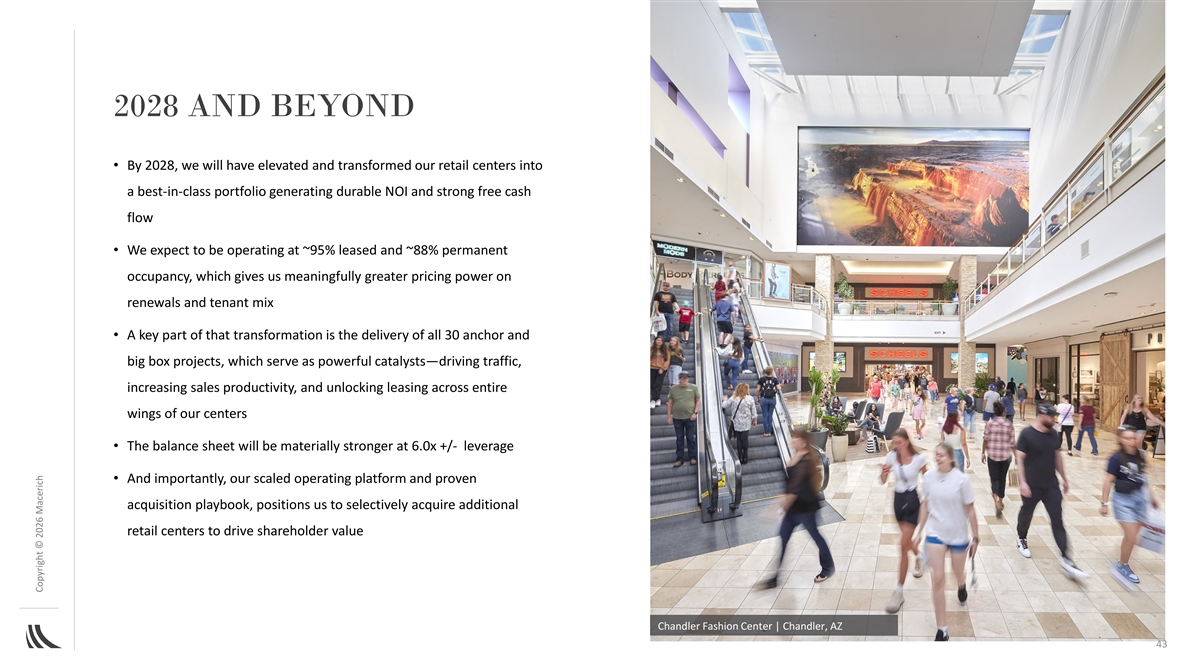
2028 AND BEYOND • By 2028, we will have elevated and transformed our retail centers into a best-in-class portfolio generating durable NOI and strong free cash flow • We expect to be operating at ~95% leased and ~88% permanent occupancy, which gives us meaningfully greater pricing power on renewals and tenant mix • A key part of that transformation is the delivery of all 30 anchor and big box projects, which serve as powerful catalysts—driving traffic, increasing sales productivity, and unlocking leasing across entire wings of our centers • The balance sheet will be materially stronger at 6.0x +/- leverage • And importantly, our scaled operating platform and proven acquisition playbook, positions us to selectively acquire additional retail centers to drive shareholder value Chandler Fashion Center | Chandler, AZ 43 Copyright © 2026 Macerich
APPENDIX 44 Washington Square | Portland, OR
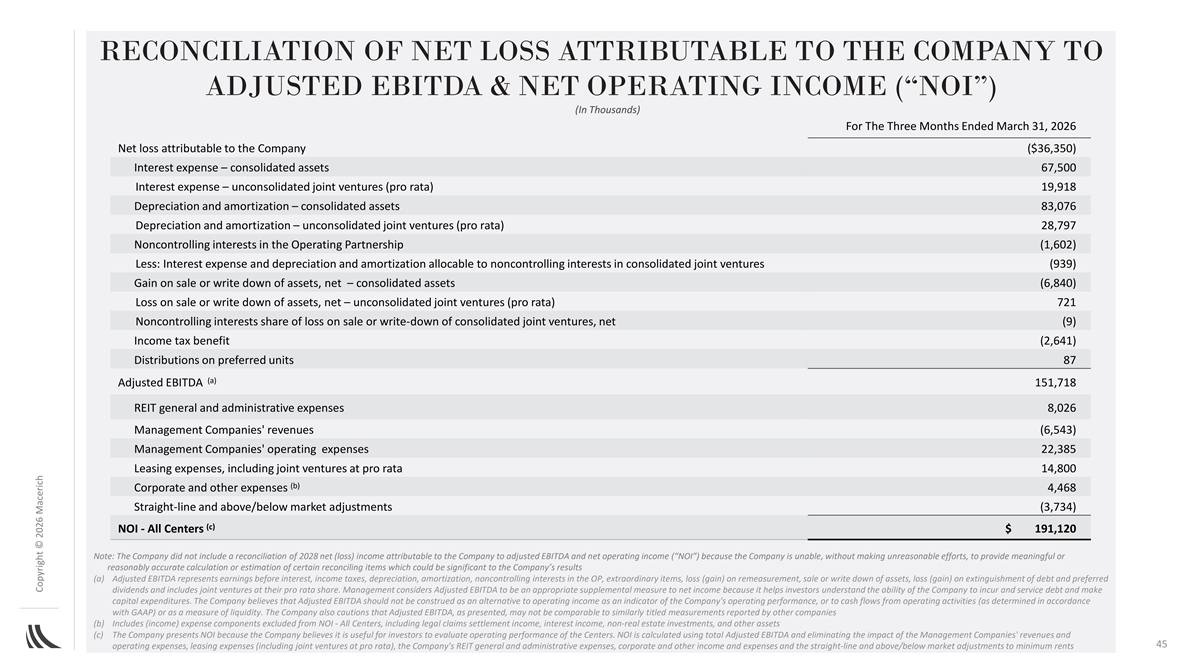
RECONCILIATION OF NET LOSS ATTRIBUTABLE TO THE COMPANY TO ADJUSTED EBITDA & NET OPERATING INCOME (“NOI”) (In Thousands) For The Three Months Ended March 31, 2026 Net loss attributable to the Company ($36,350) Interest expense – consolidated assets 67,500 Interest expense – unconsolidated joint ventures (pro rata) 19,918 Depreciation and amortization – consolidated assets 83,076 Depreciation and amortization – unconsolidated joint ventures (pro rata) 28,797 Noncontrolling interests in the Operating Partnership (1,602) Less: Interest expense and depreciation and amortization allocable to noncontrolling interests in consolidated joint ventures (939) Gain on sale or write down of assets, net – consolidated assets (6,840) Loss on sale or write down of assets, net – unconsolidated joint ventures (pro rata) 721 Noncontrolling interests share of loss on sale or write-down of consolidated joint ventures, net (9) Income tax benefit (2,641) Distributions on preferred units 87 (a) Adjusted EBITDA 151,718 REIT general and administrative expenses 8,026 Management Companies' revenues (6,543) Management Companies' operating expenses 22,385 Leasing expenses, including joint ventures at pro rata 14,800 (b) Corporate and other expenses 4,468 Straight-line and above/below market adjustments (3,734) (c) NOI - All Centers $ 191,120 Note: The Company did not include a reconciliation of 2028 net (loss) income attributable to the Company to adjusted EBITDA and net operating income (“NOI”) because the Company is unable, without making unreasonable efforts, to provide meaningful or reasonably accurate calculation or estimation of certain reconciling items which could be significant to the Company’s results (a) Adjusted EBITDA represents earnings before interest, income taxes, depreciation, amortization, noncontrolling interests in the OP, extraordinary items, loss (gain) on remeasurement, sale or write down of assets, loss (gain) on extinguishment of debt and preferred dividends and includes joint ventures at their pro rata share. Management considers Adjusted EBITDA to be an appropriate supplemental measure to net income because it helps investors understand the ability of the Company to incur and service debt and make capital expenditures. The Company believes that Adjusted EBITDA should not be construed as an alternative to operating income as an indicator of the Company's operating performance, or to cash flows from operating activities (as determined in accordance with GAAP) or as a measure of liquidity. The Company also cautions that Adjusted EBITDA, as presented, may not be comparable to similarly titled measurements reported by other companies (b) Includes (income) expense components excluded from NOI - All Centers, including legal claims settlement income, interest income, non-real estate investments, and other assets (c) The Company presents NOI because the Company believes it is useful for investors to evaluate operating performance of the Centers. NOI is calculated using total Adjusted EBITDA and eliminating the impact of the Management Companies' revenues and 45 operating expenses, leasing expenses (including joint ventures at pro rata), the Company's REIT general and administrative expenses, corporate and other income and expenses and the straight-line and above/below market adjustments to minimum rents Copyright © 2026 Macerich
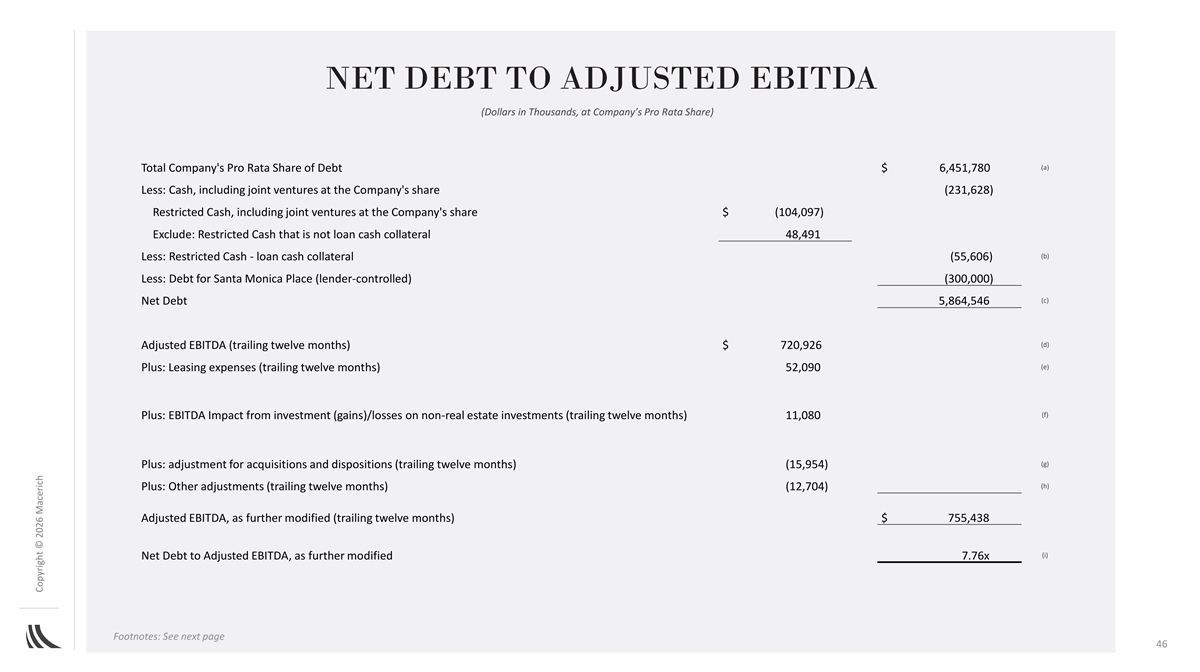
NET DEBT TO ADJUSTED EBITDA (Dollars in Thousands, at Company’s Pro Rata Share) (a) Total Company's Pro Rata Share of Debt $ 6,451,780 Less: Cash, including joint ventures at the Company's share (231,628) Restricted Cash, including joint ventures at the Company's share $ (104,097) Exclude: Restricted Cash that is not loan cash collateral 48,491 (b) Less: Restricted Cash - loan cash collateral (55,606) Less: Debt for Santa Monica Place (lender-controlled) (300,000) (c) Net Debt 5,864,546 (d) Adjusted EBITDA (trailing twelve months) $ 720,926 (e) Plus: Leasing expenses (trailing twelve months) 52,090 (f) Plus: EBITDA Impact from investment (gains)/losses on non-real estate investments (trailing twelve months) 11,080 (g) Plus: adjustment for acquisitions and dispositions (trailing twelve months) (15,954) (h) Plus: Other adjustments (trailing twelve months) (12,704) Adjusted EBITDA, as further modified (trailing twelve months) $ 755,438 (i) Net Debt to Adjusted EBITDA, as further modified 7.76x Footnotes: See next page 46 Copyright © 2026 Macerich
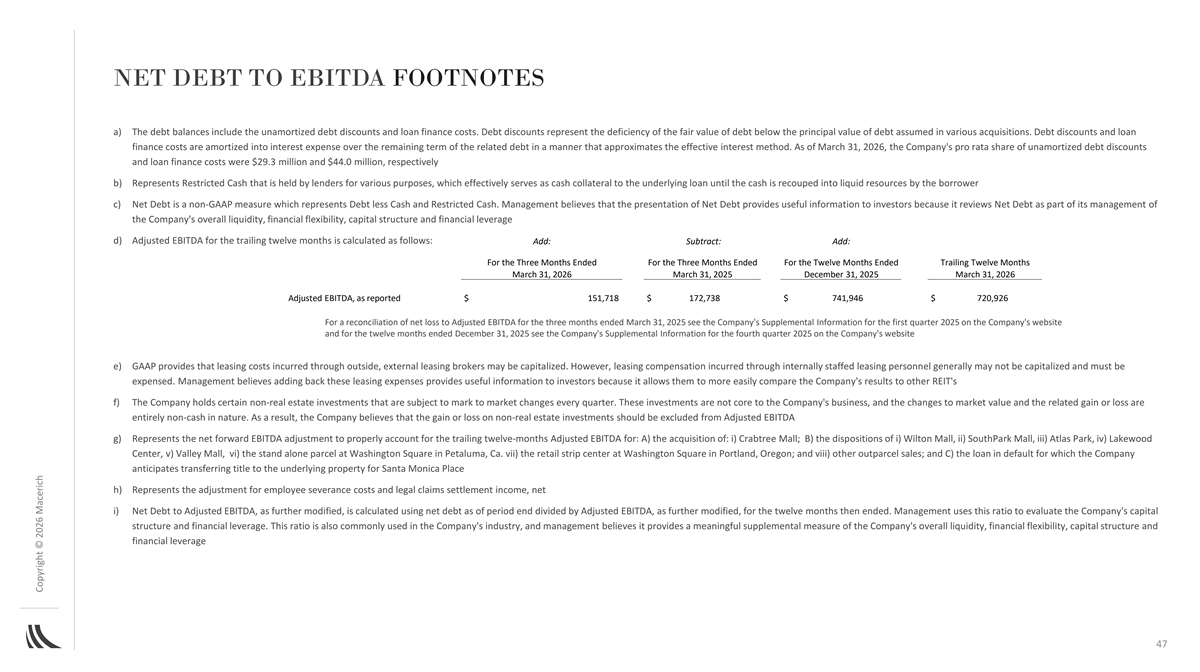
NET DEBT TO EBITDA FOOTNOTES a) The debt balances include the unamortized debt discounts and loan finance costs. Debt discounts represent the deficiency of the fair value of debt below the principal value of debt assumed in various acquisitions. Debt discounts and loan finance costs are amortized into interest expense over the remaining term of the related debt in a manner that approximates the effective interest method. As of March 31, 2026, the Company's pro rata share of unamortized debt discounts and loan finance costs were $29.3 million and $44.0 million, respectively b) Represents Restricted Cash that is held by lenders for various purposes, which effectively serves as cash collateral to the underlying loan until the cash is recouped into liquid resources by the borrower c) Net Debt is a non-GAAP measure which represents Debt less Cash and Restricted Cash. Management believes that the presentation of Net Debt provides useful information to investors because it reviews Net Debt as part of its management of the Company's overall liquidity, financial flexibility, capital structure and financial leverage d) Adjusted EBITDA for the trailing twelve months is calculated as follows: Add: Subtract: Add: For the Three Months Ended For the Three Months Ended For the Twelve Months Ended Trailing Twelve Months March 31, 2026 March 31, 2025 December 31, 2025 March 31, 2026 Adjusted EBITDA, as reported $ 151,718 $ 172,738 $ 741,946 $ 720,926 For a reconciliation of net loss to Adjusted EBITDA for the three months ended March 31, 2025 see the Company's Supplemental Information for the first quarter 2025 on the Company's website and for the twelve months ended December 31, 2025 see the Company's Supplemental Information for the fourth quarter 2025 on the Company's website e) GAAP provides that leasing costs incurred through outside, external leasing brokers may be capitalized. However, leasing compensation incurred through internally staffed leasing personnel generally may not be capitalized and must be expensed. Management believes adding back these leasing expenses provides useful information to investors because it allows them to more easily compare the Company's results to other REIT's f) The Company holds certain non-real estate investments that are subject to mark to market changes every quarter. These investments are not core to the Company's business, and the changes to market value and the related gain or loss are entirely non-cash in nature. As a result, the Company believes that the gain or loss on non-real estate investments should be excluded from Adjusted EBITDA g) Represents the net forward EBITDA adjustment to properly account for the trailing twelve-months Adjusted EBITDA for: A) the acquisition of: i) Crabtree Mall; B) the dispositions of i) Wilton Mall, ii) SouthPark Mall, iii) Atlas Park, iv) Lakewood Center, v) Valley Mall, vi) the stand alone parcel at Washington Square in Petaluma, Ca. vii) the retail strip center at Washington Square in Portland, Oregon; and viii) other outparcel sales; and C) the loan in default for which the Company anticipates transferring title to the underlying property for Santa Monica Place h) Represents the adjustment for employee severance costs and legal claims settlement income, net i) Net Debt to Adjusted EBITDA, as further modified, is calculated using net debt as of period end divided by Adjusted EBITDA, as further modified, for the twelve months then ended. Management uses this ratio to evaluate the Company's capital structure and financial leverage. This ratio is also commonly used in the Company's industry, and management believes it provides a meaningful supplemental measure of the Company's overall liquidity, financial flexibility, capital structure and financial leverage 47 Copyright © 2026 Macerich
MACERICH (NYSE: MAC) ONE OF THE NATION’S LEADING OWNERS, OPERATORS & DEVELOPERS OF MAJOR RETAIL PROPERTIES IN ATTRACTIVE U.S. MARKETS, INCLUDING CALIFORNIA, PHOENIX/SCOTTSDALE, PACIFIC NORTHWEST, GREATER NEW YORK, NORTH CAROLINA AND WASHINGTON, D.C.